Wednesday, February 27, 2019

The best city to live in every state

Corrections & Clarifications: A previous version of this story misstated the geographical location of Waynesboro, Virginia.

There are nearly 20,000 villages, towns and cities across the 50 states, and not all of them are equally conducive to the well-being of those who live there.

While quality of life is subject to a range of factors – close relationships and personal health being among the most important – the local community and environment can also have a meaningful impact.

When it comes to choosing a place to call home, everyone has their own priorities and subjective tastes. Still, there are specific attributes some communities share that are almost universally desirable: safe streets, a strong economy, affordability and a range of entertainment options, to name a few.

24/7 Wall St. created a weighted index of over two dozen measures to identify the best city to live in each state. We considered all boroughs, census designated places, cities, towns and villages with at least 8,000 residents.

Start the day smarter: Get USA TODAY's Daily Briefing in your inbox

More: 25 industries experiencing the fastest growth in the US economy

More: 25 cities that lost the most jobs in 2018

More: These are the most expensive zip codes in the US this year

These cities tend to have much in common beyond the index components upon which they were ranked. For one, these communities are often within commuting distance of a major metropolitan area. This is no coincidence, as close proximity to a major city provides residents with access to more job opportunities, which in turn can help lower unemployment and improve financial security.

The best cities to live in include ones just outside of Atlanta, Boston, Chicago, Los Angeles, New York City, Oklahoma City, Pittsburgh and Washington.

1. Valley, Alabama

• Population: 9,439
• 5 yr. population change: -0.8 percent
• Median home value: $82,900
• Median household income: $39,387

The majority of the cities on this list are relatively wealthy. Valley, Alabama, is an exception. The typical household in Valley earns just $39,387 a year, about $5,000 less than the typical Alabama household. Still, serious financial hardship is less common in Valley than in Alabama as a whole as 15.7 percent of area residents live below the poverty line, well below the 18.4 percent state poverty rate. Valley residents also benefit from a low cost of living as goods and services are about 6 percent less expensive in the city than they are nationwide on average.

Valley is a pilot city for the Alabama Communities of Excellence program, a non-profit that partners with governments, businesses, and universities to prepare participating communities for a more vibrant future.

Ketchikan, Alaska (Photo11: sorincolac / Getty Images)

2. Ketchikan, Alaska

• Population: 8,189
• 5 yr. population change: +2.3 percent
• Median home value: $232,500
• Median household income: $53,937

Health outcomes are an important factor in the overall quality of life in a given area. In Ketchikan, Alaska, the mortality rate of people admitted to the hospital is 12.2 per 100,000 hospital admissions within 30 days. That figure is the lowest of any major metropolitan area in the state. Ketchikan is the only metro area in Alaska with a mortality rate lower than the U.S. mortality rate of 12.9 per 100,000.

Thanks to its scenery along the southeastern coast of Alaska and proximity to the continental United States, Ketchikan is a popular tourist destination, especially on cruises. Though much of Alaska is isolated and rural, Ketchikan offers residents and visitors access to many more entertainment options than most parts of the state – which can be important during the long, dark winters. Ketchikan has more bars, restaurants, and movie theaters than almost anywhere else in the state.

3. Paradise Valley, Arizona

• Population: 13,833
• 5 yr. population change: +5.6 percent
• Median home value: $1,332,600
• Median household income: $173,487

Most houses in Paradise Valley, Arizona, are worth over $1.3 million, more than seven times the U.S. median home value. Paradise Valley residents are able to afford such expensive houses because of their relatively high incomes. The typical household in the city earns $173,487 a year, one of the highest median household incomes in the country.

Paradise Valley lives up to its name as a popular destination to relax. The town is home to several resorts and a number of golf courses. Located just north of Phoenix and Scottsdale, it is also known for its high-end dining and nightlife.

4. Batesville, Arkansas

• Population: 10,579
• 5 yr. population change: +4.5 percent
• Median home value: $120,400
• Median household income: $42,143

Batesville, Arkansas, ranks among the best U.S. cities to live largely due to its affordability and community attractions and amenities. Most homeowners in Batesville pay less than $1,000 a year in property taxes, less than half the amount the typical American homeowner pays. Overall annual housing costs typically come to about $7,500 a year, roughly $4,600 less than the median costs nationwide. Goods and services are 16 percent less expensive on average in Batesville than they are nationwide.

With roots as far back as 1804, Batesville is the second oldest city in Arkansas. The city, which avoided destruction in the Civil War, has a number of historic buildings and sites. There are attractions in the area for nearly every taste and preference, including antique stores, art galleries, an annual film festival, and the Batesville Motor Speedway.

Palos Verdes Estates, California (Photo11: Focqus, LLC / Getty Images)

5. Palos Verdes Estates, California

• Population: 13,582
• 5 yr. population change: +1.3 percent
• Median home value: $1,609,500
• Median household income: $200,766

Located along the Pacific Coast less than 30 miles from Los Angeles, Palos Verdes Estates is the best place in California to live. One of the wealthiest neighborhoods in the country, the typical household earns over $200,000 a year, more than triple the national median household income of $55,322. Crime is virtually unheard of in Palos Verdes Estates as its violent crime rate of 22 incidents per 100,000 people is a small fraction of the national rate of 383 per 100,000.

The high ranking may not come as a surprise to those familiar with it, as it is a master-planned city, designed by the Olmsted Brothers, sons of Frederick Law Olmsted – architect of New York City's Central Park and the Stanford University campus.

6. Frederick, Colorado

• Population: 10,791
• 5 yr. population change: +32.2 percent
• Median home value: $261,500
• Median household income: $90,321

Frederick, a small town about a half hour north of Denver, ranks as Colorado's best city to live in. The town boasts a number of amenities that make it an attractive place to live, including a museum, a golf course, over 20 community parks, 25 skiing areas in driving distance, and over 300 sunny days a year.

Like many communities on this list, Frederick is relatively affluent and fast growing. The typical area household earns $90,321 a year, about $27,800 more than the median income across Colorado as a whole. Additionally, in the last five years, the number of people living in Frederick climbed 32.2 percent. For reference, the U.S. population grew by just 3.9 percent over the same period.

7. Darien, Connecticut

• Population: 21,519
• 5 yr. population change: +4.6 percent
• Median home value: $1,248,200
• Median household income: $208,125

Darien, Connecticut is home to one of the wealthiest and best educated populations in the country. Well over half of all households in Darien earn at least $200,000 a year and about four out of five adults in Darien have a bachelor's degree or higher. Nationwide, fewer than one in three adults have a bachelor's degree. A high median income is bolstered not only by high educational attainment, but also by a strong job market. Just 3.6 percent of workers in Darien were unemployed in 2017, below the 4.7 percent state and 4.4 percent national 2017 unemployment rates.

Darien is also one of the safest communities in the country. There were just 14 violent crimes for every 100,000 residents in 2017, a fraction of the 383 violent crimes per 100,000 people nationwide.

8. Middletown, Delaware

• Population: 20,045
• 5 yr. population change: +13.8 percent
• Median home value: $274,400
• Median household income: $87,250

Middletown ranks as the best community in Delaware to live in. The town boasts several public parks with a range of amenities, including tennis and basketball courts, soccer and baseball fields, pavilions, a track, and a pool. A relatively affluent area, Middletown has a median income of $87,250, about $26,200 more than the median income in Delaware as a whole. Home values are also about 18 percent higher than the average across the state and over half of all homes in Middletown are worth over a quarter-million dollars.

Like many of the cities and towns on this list, Middletown is growing rapidly. In the last five years, Middletown's population climbed 13.8 percent.

9. Pinecrest, Florida

• Population: 19,272
• 5 yr. population change: +5.2 percent
• Median home value: $840,900
• Median household income: $130,900

Pinecrest is by far the wealthiest place in Florida, and one of the wealthiest in the entire country. With a median household income of $130,900, most Pinecrest households earn more than double what the typical Florida household earns, which is $48,900. Partially because of the area's relatively high income, the typical home in Pinecrest costs more than $840,000 – more than four times the median Florida home.

A Miami suburb just off Biscayne Bay, Pinecrest is also one of the best educated areas of the state. Among adults 25 and older, 61.7 percent have at least a bachelor's degree. Statewide, just 27.9 percent of adults finished college.

10. Milton, Georgia

• Population: 36,755
• 5 yr. population change: +19.1 percent
• Median home value: $475,300
• Median household income: $109,784

A planned community incorporated in 2006, Milton is one of the most rapidly growing cities in Georgia. Now home to nearly 37,000 people, Milton's population more than doubled since 2009 and is projected to reach 43,000 by 2030. In commuting distance of Atlanta, many Milton residents likely commute to high paying jobs in the state's largest city. The typical household in Milton earns $109,784 a year, more than double the median income of $51,037 across the state as a whole. Similarly, Milton's poverty rate of 5.5 percent is less than a third of the 17.8 percent statewide poverty rate.

Milton is also a safe city. There were just 23 violent crimes for every 100,000 residents in 2017, a fraction of the 383 per 100,000 national rate.

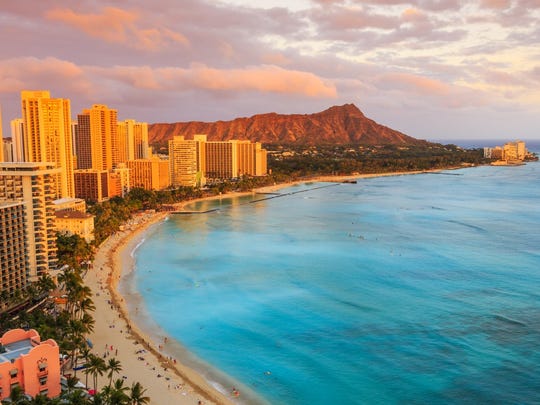
Honolulu, Hawaii (Photo11: sorincolac / Getty Images)

11. Urban Honolulu, Hawaii

• Population: 349,597
• 5 yr. population change: +4.3 percent
• Median home value: $601,500
• Median household income: $63,361

Education can be an important factor in the health and well being of a population. In addition to being more financial stable, college graduates tend to live longer and healthier lives than those who did not obtain at least a bachelor's degree. A high level of education helps make Urban Honolulu the best city to live in Hawaii. Among Honolulu adults, 36 percent have at least a bachelor's degree, the highest rate in Hawaii.

Long commutes by car can have a negative effect on physical and mental health. Honolulu residents utilize alternative methods of getting to and from work. Roughly one in every eight residents takes public transportation to work, while many others walk or ride their bicycles. Altogether, 22.9 percent of commuters do not drive themselves to their jobs, over five times more than the next closest city in Hawaii.

12. Hailey, Idaho

• Population: 8,058
• 5 yr. population change: +2.6 percent
• Median home value: $266,500
• Median household income: $56,522

Hailey is situated in Idaho's Wood River Valley in the Rocky Mountains. The city is surrounded by public land and forests where residents and visitors can hike, bike, ski, fish, and horseback ride, and is a short drive from Ketchum and Sun Valley, two resort towns.

Quality of life for residents is boosted by lower than average crime, poverty, and unemployment rates. While the median household income of $56,522 in Hailey is only about $1,000 higher than the national median income, a dollar goes further in Hailey than in much of the rest of the country. Goods and services are about 4 percent less expensive than they are nationwide on average.

13. Winnetka, Illinois

• Population: 12,437
• 5 yr. population change: +2.3 percent
• Median home value: $989,600
• Median household income: $207,857

Winnetka is a small village that sits on the shores of Lake Michigan about 15 miles north of downtown Chicago. One of the wealthiest cities in the state, the typical Winnetka household earns $207,857 a year. Winnetka residents working in Chicago have options when it comes to transit, as over one quarter of commuters use public transportation – an alternative most Americans do not have.

In the village, downtown shops were described by the Chicago Tribune in 2012 as reminiscent of the Hamptons on Long Island in New York, without the celebrities. Winnetka boasts four beaches, a boat launch, several parks, a tennis club, a golf course, an ice rink, and forest preserve areas, all open to the public.

14. Jasper, Indiana

• Population: 15,790
• 5 yr. population change: +6.6 percent
• Median home value: $148,200
• Median household income: $55,209

Jasper is one of the most affordable places to live in Indiana. The cost of living in the city is just 83.6 percent of what the typical American pays. The median household income in Jasper of $55,209 is higher than Indiana's median of $50,433. The combination of relatively high income and low costs, as compared to the rest of the state, makes Jasper residents more able to afford homes compared to those in most other areas of Indiana. The median home price in Jasper is $148,200, compared to Indiana's median home price of $126,500.

Jasper residents are much less likely to struggle with money than the average Indiana resident. Statewide, 15 percent of Indiana residents live in poverty. In Jasper, the poverty rate is less than half that, at 7.1 percent.

15. Le Mars, Iowa

• Population: 9,826
• 5 yr. population change: +1.0 percent
• Median home value: $139,400
• Median household income: $56,851

Le Mars, Iowa, is among the most affordable cities in the United States. Goods and services in the city cost about 15 percent less on average than they do nationwide. Housing is particularly inexpensive, with the typical household spending $8,124 a year, about $4,000 less than the average annual housing cost nationwide.

The city also has its share of attractions. Home to a Blue Bunny ice cream manufacturing plant, Le Mars churns out more ice cream from a single company than any other city, earning the nickname "The Ice Cream Capital of the World." The city and surrounding area also boast a history museum, an art museum, a golf course, a campground, and of course, an ice cream museum.

McPherson, Kansas (Photo11: BOB WESTON / Getty Images)

16. McPherson, Kansas

• Population: 13,212
• 5 yr. population change: +0.0 percent
• Median home value: $135,800
• Median household income: $54,057

The median household income in McPherson, Kansas of $54,057 a year is just below the national median of $55,322. However, a dollar goes a long way in McPherson as goods and services are 14 percent less expensive than they are on average nationwide. Indeed, extreme financial hardship is relatively rare in the city. Just 7.3 percent of residents live in poverty compared to 13.3 percent of the Kansas population.

McPherson residents also have many options when it comes to entertainment and recreation. The city has a far greater than typical concentration of restaurants, fitness centers, museums, golf courses, and movie theatres.

17. Edgewood, Kentucky

• Population: 8,703
• 5 yr. population change: +0.5 percent
• Median home value: $204,300
• Median household income: $89,073

The best city to live in in Kentucky, Edgewood is both wealthy and affordable. The typical household in Edgewood earns $89,073, nearly double the $44,811 median income across the state as a whole. Additionally, goods and services are about 11 percent less expensive in Edgewood than they are nationwide on average.

Overall quality of life in Edgewood is boosted by two large public parks and an easily accessible hospital and medical care center within city limits. Located about seven miles south of Cincinnati across the Ohio River, Edgewood – like many cities on this list – is in commuting distance of a major metropolitan area.

18. Youngsville, Louisiana

• Population: 10,878
• 5 yr. population change: +41.5 percent
• Median home value: $222,300
• Median household income: $94,564

Youngsville is a relatively prosperous city in one of the poorest states in the country. The typical Youngsville household earns about $95,000 a year and just 5.5 percent of the population live in poverty. Meanwhile, the typical Louisiana household earns less than $46,000 a year and nearly one in five state residents live in poverty. A dollar also goes farther than typical in Youngsville, as goods and services are about 7 percent less expensive than they are on average nationwide.

Youngsville residents have benefitted from a 70 acre, multimillion dollar sports complex since its completion in 2014 and a recreation center that opened in 2016. The facility boasts 10 tennis courts, six soccer fields, five baseball fields, batting cages, a fishing pond, a one-mile walking path, and a playground.

19. Bath, Maine

• Population: 8,334
• 5 yr. population change: -3.6 percent
• Median home value: $164,600
• Median household income: $42,275

Bath is the best place to live in Maine. Bolstered largely by Bath Iron Works, a shipbuilding plant operated by defense giant General Dynamics, the city's job market is relatively strong. Annual unemployment in the city, located near the mouth of the Kennebec River, stands at 3.2 percent, well below the 4.4 percent national rate. Many residents also benefit from the city's walkability as more than one in 10 commuters in Bath walk to work, more than triple the comparable national share. The city is also relatively safe, and also has a high concentration of restaurants, fitness centers, museums, and libraries.

Despite its advantages, Bath is one of only a handful of cities on this list to be shrinking in size. Over the last five years, Bath's population declined by 3.6 percent, even as the total U.S. population grew 3.9 percent.

20. Bowie, Maryland

• Population: 57,633
• 5 yr. population change: +5.7 percent
• Median home value: $303,900
• Median household income: $106,098

Just a short commute from Washington, D.C., Bowie, Maryland, provides easy access to high-paying jobs in and around the nation's capital. Most households in Bowie earn more than $106,000 per year – over $30,000 higher than Maryland's state median household income. Just a small share of Bowie residents live in poverty. Its poverty rate is just 3.3 percent, just one-third of the state's poverty rate.

In order to qualify for these high-level jobs, many of Bowie's residents are well-educated. Nearly half of all adults living in Bowie hold at least a college degree, as compared to 38.4 percent of Maryland residents overall.

21. Winchester, Massachusetts

• Population: 22,491
• 5 yr. population change: +6.1 percent
• Median home value: $796,500
• Median household income: $149,321

Winchester is the best-educated place in Massachusetts and one of the most highly-educated in the entire country. Nearly three-quarters of adults in the area have at least a bachelor's degree. This college degree attainment rate is well above that of Massachusetts, which sits at 41.2 percent.

This high level of education, coupled with the fact that Winchester is just outside of Boston, can make it easier for residents to find jobs. Winchester has the lowest unemployment rate, at 2.7 percent, of anywhere in the state. Massachusetts' unemployment rate is a full percentage point higher. This high level of employment likely helps drive down the poverty rate in Winchester. Just 2.4 percent of Winchester residents live below the poverty line, the lowest share in Massachusetts.

22. East Grand Rapids, Michigan

• Population: 11,297
• 5 yr. population change: +5.2 percent
• Median home value: $303,400
• Median household income: $118,393

East Grand Rapids is one of the wealthiest cities in both Michigan and the United States. The typical area household earns over $118,000 a year, compared to the $55,322 the typical household earns nationwide. City residents also benefit from a low cost of living as goods and services are 7 percent less expensive in East Grand Rapids than they are on average nationwide.

In addition to entertainment and cultural attractions in nearby Grand Rapids, East Grand Rapids has 10 parks, including a lake with a boat launch, miles of trails, playgrounds, and a baseball field.

23. New Ulm, Minnesota

• Population: 13,279
• 5 yr. population change: -1.6 percent
• Median home value: $133,100
• Median household income: $52,244

Residents of New Ulm, Minnesota, are more likely to work and be financially secure, on average, than most other Americans. The town's poverty rate of 8.5 percent is well below the national poverty rate of 15.1 percent. Also, the town's five-year average unemployment rate of 2.6 percent is 4.8 percentage points below the comparable nationwide rate.

These numbers are better than the comparable national figures despite the fact that New Ulm residents tend to not be especially wealthy. The town's median household income of $52,244 a year is several thousand dollars lower than the U.S. median household income. Unlike almost all other places on this list, New Ulm's population shrank over the past five years. During a time when the U.S. population grew 3.9 percent, New Ulm's population dropped 1.6 percent.

24. Madison, Mississippi

• Population: 25,473
• 5 yr. population change: +7.1 percent
• Median home value: $243,500
• Median household income: $100,978

Madison, a city located along a reservoir less than 20 miles north of the state capital, ranks as Mississippi's best city to live in. Madison is a relatively wealthy community, with a median income of $100,978 – more than double the $40,528 median income statewide. The average cost of living in Madison is also about 8 percent lower than it is nationwide.

Madison residents have access to several public parks with amenities that include an archery range, baseball and soccer fields, walking trails, batting cages, and an outdoor learning center.

25. Ladue, Missouri

• Population: 8,579
• 5 yr. population change: +1.1 percent
• Median home value: $771,500
• Median household income: $186,371

One of the wealthiest cities in Missouri, Ladue's median household income of $186,371 a year is more than triple the national median income of $55,322. Not only is Ladue a wealthy city, but it is also inexpensive. Goods and services are 11 percent cheaper on average in Ladue than they are typically nationwide.

With easy access to jobs in nearby St. Louis, Ladue residents who want a job generally have no trouble finding one. Over the last five years, unemployment stood at just 2.0 percent in the city, a fraction of the national rate of 7.4 percent. In addition to cultural attractions and entertainment venues in St. Louis, Ladue residents enjoy a greater than typical concentration of restaurants, fitness and recreation centers, golf courses, and museums within their own city limits.

26. Miles City, Montana

• Population: 8,667
• 5 yr. population change: +3.6 percent
• Median home value: $130,100
• Median household income: $47,383

Miles City is the least expensive place to live in Montana. The city has the lowest property taxes at just $1,480 per year, as well as the least expensive median monthly housing cost at $655. Though Miles City's $47,383 median household income is one of the lower such figures in Montana, a relatively small share of residents are impoverished. The area's poverty rate of 13.5 percent is one of the lowest in the state, and well below Montana's statewide poverty rate of 14.9 percent.

Miles City ranks as Montana's best city to live in part because it is the safest place in the state. Its violent crime rate of 104 reported incidents per 100,000 residents is less than half the rate of the next safest place in the state. Miles City also has Montana's lowest property crime rate.

27. Norfolk, Nebraska

• Population: 24,398
• 5 yr. population change: +1.9 percent
• Median home value: $123,200
• Median household income: $45,401

Norfolk is a small city of just under 25,000 in northeastern Nebraska. A relatively safe city, Norfolk's violent crime rate of 148 incidents per 100,000 residents is less than half the national rate of 383 per 100,000. Though the typical household in Norfolk earns just $45,401 a year, about $10,000 less than the typical American household, a dollar goes a long way in Norfolk. Goods and services in and around the area are about 14.5 percent less expensive than they are nationwide on average.

Elko, Nevada (Photo11: jmoor17 / Getty Images)

28. Elko, Nevada

• Population: 20,078
• 5 yr. population change: +11.0 percent
• Median home value: $215,100
• Median household income: $76,826

Elko has by far the highest median household income of anywhere in Nevada. No other area in the state came within $20,000 of Elko's median household income of $76,826. Although Elko residents tend to earn a relatively high amount, it is the least expensive place to live in Nevada. The cost of living in Elko is just 83.9 percent of what it costs in the typical American city.

Elko is the fastest-growing place in Nevada by a wide margin. In the past seven years, its population increased 18.7 percent to just over 20,000 people. During that same timeframe, no other place in the state had a population increase of more than 10 percent.

29. Hanover, New Hampshire

• Population: 8,482
• 5 yr. population change: +0.0 percent
• Median home value: $469,300
• Median household income: $96,406

Hanover has numerous advantages over other places in New Hampshire cities. Its median household income of $96,406 is more than $26,000 higher than the next closest city and well ahead of the statewide median, which is $68,485. Hanover is also the best educated place in the state, as 83.1 percent of adults hold at least a bachelor's degree. No other city in New Hampshire comes close to that share. For comparison, the state's bachelor's degree attainment rate is 35.5 percent.

With a population of 8,482, Hanover is a smaller city. As such, many residents are able to walk to and from work. Walking not only provides numerous health benefits, but also helps decrease road traffic and reduce pollution. Some 40 percent of Hanover residents commute by walking – by far the highest rate in New Hampshire and the second highest rate of any U.S. city.

30. Haddonfield, New Jersey

• Population: 11,444
• 5 yr. population change: -1.3 percent
• Median home value: $487,700
• Median household income: $135,700

Haddonfield is one of the most economically prosperous places in New Jersey and the United States as a whole. The typical Haddonfield home earns $135,700, nearly $62,000 more than the typical New Jersey household. Haddonfield lies just across the Delaware River from Philadelphia, providing its residents access to the jobs that city offers.

Compared to the rest of the state, Haddonfield residents are not likely to struggle with poverty. The area has a poverty rate of just 2.9 percent, well below New Jersey's poverty rate of 10.9 percent. Though Haddonfield's cost of living is 11 percent more than that of the average American city, it is still one of the lowest in New Jersey.

31. Los Alamos, New Mexico

• Population: 11,733
• 5 yr. population change: -2.9 percent
• Median home value: $277,700
• Median household income: $101,535

Los Alamos, New Mexico is flush with history, cultural amenities, and parks. These include a science museum, a theatre, nearly 100 public art installations, a network of over 90 miles of hiking trails, and the Manhattan Project National Historical Park – a monument to the city's critical role in World War II and development of the atomic bomb. Los Alamos also has one of the best public high schools in New Mexico, according to U.S. News & World Report.

Many living in the area work at the Los Alamos National Laboratory, a facility run by the U.S. Department of Energy with a $2.6 billion budget primarily allocated to weapons development.

Croton-on-Hudson, New York (Photo11: ricardocostaphotography / Getty Images)

32. Croton-on-Hudson, New York

• Population: 8,209
• 5 yr. population change: +2.8 percent
• Median home value: $519,400
• Median household income: $117,656

Croton-on-Hudson is a small village on the eastern bank of the Hudson River, less than 40 miles north of Manhattan. The village is on a train line that goes directly into the city, and largely as a result, more than one in every four workers in Croton-on-Hudson commute using public transit. The village's proximity to New York City contributes to high property values as most homes in the community are worth over half a million dollars.

Croton-on-Hudson is one of the safest communities in New York. There were just 48 violent crimes for every 100,000 village residents in 2017, about an eighth of the national violent crime rate of 383 per 100,000.

33. Morrisville, North Carolina

• Population: 22,600
• 5 yr. population change: +30.5 percent
• Median home value: $291,400
• Median household income: $92,769

Morrisville is situated in the middle of North Carolina's "Research Triangle." The cities of Raleigh, Durham, and Chapel Hill are each home to a major scientific research university – North Carolina State University, Duke University, and the University of North Carolina - Chapel Hill, respectively – and several major research-intensive industries have developed in the area.

Morrisville offers close access to each of the three universities, as well as the companies that are located nearby. Morrisville is one of the fastest-growing communities in the entire country. In the past five years, its population grew more than 30 percent, from just over 13,000 to 22,600.

34. Mandan, North Dakota

• Population: 20,613
• 5 yr. population change: +14.2 percent
• Median home value: $175,400
• Median household income: $60,034

Residents of Mandan, North Dakota benefit from a low cost of living – 13 percent lower than average nationwide – a five-year average unemployment rate of 2.0 percent, and a violent crime rate that is less than half the national rate. Mandan residents also have access to jobs, entertainment, and cultural attractions in Bismarck, the state capital located on the opposite side the Missouri River.

Recently, business leaders, elected officials, and ordinary citizens established a committee to form a comprehensive plan to improve Mandan over the coming decade. The committee's accomplishments include broadened business support and incentives, the creation of annual festivals and events, public education improvements, and increased communication regarding local elections.

35. New Albany, Ohio

• Population: 9,384
• 5 yr. population change: +25.3 percent
• Median home value: $492,400
• Median household income: $191,375

New Albany, Ohio, is one of the most affluent cities in the country. The median household income of $191,375 is one of the five highest of U.S. cities. Wealthier areas tend to have a number of livability advantages over low-income cities, including lower crime rates. There were just 36.9 violent crimes reported per 100,000 residents in New Albany, less than a tenth of the nationwide crime rate. New Albany also has many amenities for residents, including over 600 acres of parks and sports fields.

There are a number of factors that can draw people to certain towns, including jobs, schools, and amenities. New Albany excels in many of these aspects, and its population growth rate reflects that. The town's population grew by more than 25 percent over the past five years, compared to the national growth rate of just 3.9 percent.

36. Newcastle, Oklahoma

• Population: 9,030
• 5 yr. population change: +21.0 percent
• Median home value: $180,300
• Median household income: $78,144

Newcastle is a small city of less than 10,000 just outside Oklahoma City. One of the fastest growing cities in the state, Newcastle's population spiked by 21 percent in the last five years. As in other cities on this list, Newcastle residents are actively engaged in bettering their community. The city's resident-driven Bridge to 2020 initiative launched in 2007 to develop a long-term strategic plan for the community. In addition to nearby amenities in Oklahoma City, Newcastle boasts seven golf courses, six movie theatres, access to four hospitals, and two shopping malls.

A relatively affluent city, Newcastle's median income of $78,144 is about $30,000 higher than it is statewide and goods and services are about 17 percent less expensive than they are nationwide.

37. Sherwood, Oregon

• Population: 18,965
• 5 yr. population change: +7.5 percent
• Median home value: $313,000
• Median household income: $86,111

Sherwood is a small city about 15 miles southwest of Portland. In addition to amenities, attractions, and employment opportunities in the nearby city, Sherwood itself boasts over a dozen parks and a community recreation center and pool.

Quality of life in Sherwood is also bolstered by a low violent crime rate and relative financial stability. There were just 82 violent crimes for every 100,000 residents in Sherwood in 2017, less than a quarter the national violent crime rate. Additionally, Sherwood's 4.7 percent poverty rate is less than a third of both the state and national poverty rates of 15.7 percent and 15.1 percent, respectively.

38. Franklin Park, Pennsylvania

• Population: 14,228
• 5 yr. population change: +7.9 percent
• Median home value: $312,200
• Median household income: $121,661

Franklin Park, Pennsylvania, is a borough just outside of Pittsburgh. The area has a relatively high share of residents with high educational attainment. A whopping 70 percent of adults hold at least a bachelor's degree, one of the higher college attainment rates among U.S. cities. Those with college degrees are more qualified for specialized jobs that tend to have higher salaries. In Franklin Park, the median household income of $121,661 a year is one of the highest in the country.

Like many affluent, well-educated areas, Franklin Park is relatively safe. The violent crime rate of 14 incidents per 100,000 people is one of the lowest in the country. Nationwide, there were 383 violent crimes for every 100,000 people in 2017.

Newport, Rhode Island (Photo11: DenisTangneyJr / Getty Images)

39. Newport, Rhode Island

• Population: 24,570
• 5 yr. population change: -0.1 percent
• Median home value: $382,200
• Median household income: $59,794

Newport, Rhode Island is by far the best educated city in the state. More than half – 50.9 percent – of adult residents completed at least their bachelor's degree. No other major Rhode Island community exceeded the state's college graduation rate of 32.5 percent. This high educational attainment qualifies many of the city's residents for highly skilled jobs and likely helps drive down the unemployment rate. Newport's unemployment rate is just 3.8 percent, the lowest of anywhere in the country.

Though Newport's median household income is close to that of Rhode Island as a whole, homes in the area tend to be much more valuable than those in the rest of the state. Newport's median home value is $382,200, well above Rhode Island's $238,200 median home value.

40. Tega Cay, South Carolina

• Population: 9,026
• 5 yr. population change: +23.3 percent
• Median home value: $301,200
• Median household income: $120,346

Tega Cay ranks as one of the best cities to live in part because of its relatively high income and the many associated benefits that come with affluence. The city's median household income of over $120,000 is more than double the U.S. median. In a city with a high percentage of affluent households, there are also very few residents struggling with serious financial hardship. Just 0.9 percent of residents live in poverty.

Tega Cay lies near the border of the Carolinas and Lake Wiley. The water access gives residents a chance to swim, boat, and fish. As a tourist destination, the city has a high number of bars and restaurants per resident. Tega Cay is growing quickly. It was home to fewer than 5,000 people in 2009. As of 2016, more than 9,000 people lived there.

41. Pierre, South Dakota

• Population: 13,959
• 5 yr. population change: +2.2 percent
• Median home value: $164,900
• Median household income: $54,868

Most American homeowners spend more than $12,000 per year on housing. In Pierre, South Dakota, most spend less than $8,500 annually. Overall, the cost of living is lower in Pierre, as goods and services are 15 percent less expensive than they are on average nationwide.

Pierre, South Dakota's capital, is home to many outdoor amenities largely thanks to its proximity to the Missouri River. Nearby Farm Island and LaFramboise Island offer residents the opportunity to take part in outdoor activities like swimming and hiking.

42. Atoka, Tennessee

• Population: 8,917
• 5 yr. population change: +11.9 percent
• Median home value: $172,400
• Median household income: $87,047

Many cities and towns on this list are in close proximity to a major metropolitan area. About 25 miles northeast of Memphis, Atoka is one of them. In addition to attractions and amenities in Memphis, Atoka itself has several parks featuring playgrounds, sports fields, picnic areas, and a fishing pond.

A safe community, Atoka's violent crime rate of 152 incidents per 100,000 people is less than half the national violent crime rate. Safe streets and proximity to a major city make Atoka an attractive place for new residents and families, and in the last five years, the city's population expanded by 11.9 percent, triple the comparable 3.9 percent national growth rate.

43. West University Place, Texas

• Population: 15,318
• 5 yr. population change: +4.0 percent
• Median home value: $917,800
• Median household income: $220,868

A wealthy suburb of Houston, West University Place ranks as the best city to live in Texas. A wealthy city, the median household income of nearly $221,000 a year is nearly four times the income the typical American household earns. A dollar also goes far in the city as goods and services are about 5 percent less expensive than they are nationwide on average. In addition to entertainment and culture in nearby Houston, West University has a far greater concentration of restaurants, bars, fitness centers, museums and theatre companies than is typical nationwide.

West University is also a safe city with a strong job market. The city's violent crime rate of 64 incidents for every 100,000 people is among the lowest in the nation, as is the five-year average unemployment rate of 2.7 percent.

44. Woods Cross, Utah

• Population: 10,930
• 5 yr. population change: +15.5 percent
• Median home value: $226,200
• Median household income: $78,750

Just north of Salt Lake City, Woods Cross provides easy access to Utah's largest city, as well as the Great Salt Lake to the west and Grandview Peak to the east. The proximity to Salt Lake City affords Woods Cross residents a short commute to the city, which may help bolster the city's labor force participation rate. More than three quarters of Woods Cross adults, 77.4 percent, participate in the labor force, the most of any Utah community.

This high labor force participation likely helps drive up the median household income. The typical Woods Cross household earns $78,750 each year, well ahead of Utah's $62,518 median household income.

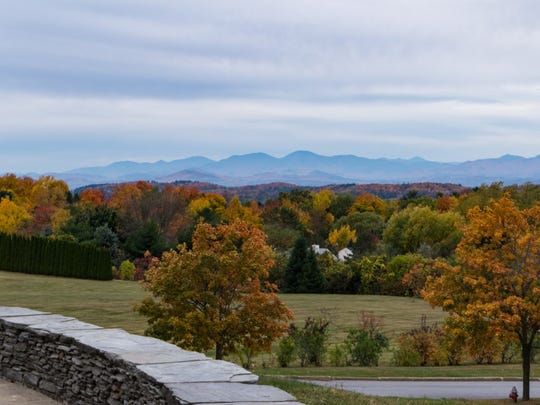
South Burlington, Vermont (Photo11: vermontalm / Getty Images)

45. South Burlington, Vermont

• Population: 18,704
• 5 yr. population change: +6.2 percent
• Median home value: $271,900
• Median household income: $66,728

Sitting along Lake Champlain, South Burlington is adjacent to Burlington, the largest city in Vermont. With access to a number of nearby colleges, including Champlain College and the University of Vermont, South Burlington's population is well educated. Over half of all the city's adult residents have a bachelor's degree or higher, well above the 30.3 percent national bachelor's degree attainment rate. There are a range of employment opportunities in the area, including the University of Vermont Medical Center. Just 2.0 percent of workers in South Burlington were unemployed in 2017, below both the 3.0 percent state and 4.4 percent national unemployment rates.

A strong job market bolsters the financial security of area residents. Just 6.2 percent of South Burlington's population live in poverty, less than half the 15.1 percent national poverty rate.

46. Waynesboro, Virginia

• Population: 21,366
• 5 yr. population change: +1.7 percent
• Median home value: $158,800
• Median household income: $45,097

Waynesboro, an independent city in Virginia, is notable for its affordability, safety, and scenic beauty. Goods and services in the city are about 7 percent less expensive than they are nationwide on average. Additionally, the violent crime rate of 182 incidents per 100,000 people is less than half the U.S. violent crime rate of 383 per 100,000.

Located in the Shenandoah Valley, Waynesboro offers easy access to the scenic Blue Ridge Parkway and the Appalachian Trail. The South River cuts through the city, providing a water trail for residents to fish and enjoy by boat. Waynesboro also has a higher than typical concentration of restaurants, movie theatres, and museums.

47. Snoqualmie, Washington

• Population: 12,510
• 5 yr. population change: +28.3 percent
• Median home value: $471,800
• Median household income: $131,453

Snoqualmie, Washington, is one of the safest places in the country, with just 15 violent crimes for every 100,000 city residents in 2017. The town's property crime rate of 1,077 incidents per 100,000 residents is also less than half the national rate.

Areas with higher median household incomes tend to have less crime than lower income areas. The median annual household income in Snoqualmie, which is within commuting distance of Seattle, is $131,453 a year, one of the higher incomes among American cities. In addition to the culture and entertainment Seattle has to offer, Snoqualmie has a higher than typical concentration of restaurants, bars, museums, and movie theatres.

Bridgeport, West Virginia (Photo11: NoDerog / Getty Images)

48. Bridgeport, West Virginia

• Population: 8,364
• 5 yr. population change: +3.9 percent
• Median home value: $199,000
• Median household income: $80,462

In Bridgeport, 45.3 percent of adults have graduated from college, nearly the highest share of cities in the state. The high college attainment rate has likely contributed to the town's relatively high median household income of $80,462 a year. Not only is Bridgeport wealthy, but it is also inexpensive. Goods and services are 15 percent less expensive than average in the city.

When it comes to culture and entertainment, Bridgeport residents have options. The city is home to a far higher concentration of restaurants, bars, recreation centers, golf courses, and movie theatres than is typical nationwide.

49. Whitefish Bay, Wisconsin

• Population: 14,088
• 5 yr. population change: +0.4 percent
• Median home value: $350,700
• Median household income: $105,156

Whitefish Bay, a Milwaukee suburb along the shore of Lake Michigan, ranks as the best place to live in Wisconsin. The high quality of life in Whitefish Bay is partially the result of a strong job market. The area's average unemployment rate over the last five years stands at just 3.2 percent – less than half the comparable nationwide rate of of 7.4 percent.

Whitefish Bay is also one of the safest communities in the country, with a violent crime rate of just 36 incidents per 100,000 people. For reference, there were 383 violent crimes per 100,000 people nationwide in 2017.

50. Jackson, Wyoming

• Population: 10,279
• 5 yr. population change: +7.6 percent
• Median home value: $573,400
• Median household income: $70,517

The resort town of Jackson ranks as the best place to live in Wyoming. Jackson boasts a high concentration of restaurants, bars, museums, and movie theatres, as well as access to Jackson Hole, one of the most famous ski resorts in the United States.

Incomes are relatively high in Jackson. The typical area household earns $70,517 a year, about $11,000 more than the typical Wyoming household. Higher incomes are not enough to offset the area's high cost of living, however, as goods and services are about 35 percent more expensive in Jackson than they are on average nationwide. Housing is particularly expensive as most area homes are worth over half a million dollars.

Methodology

To identify the best cities to live in every state, 24/7 Wall St. created a weighted index of 26 measures that fall into one of four categories: affordability, economy, quality of life, and community.

In the affordability category, the ratio of the median home value to the median income was given full weight. Cities where the median home value is closer to the median household income were rewarded. Cost of living, as determined by the average cost of goods and services in an area relative to the nation as a whole, was given a full weight. Property taxes are largely levied at the local level, and cities where residents pay more property taxes as a percentage of their home value were penalized. Property taxes were given a one-quarter weighting.

In the economy category, we gave median household income full weighting. The unemployment rate was also given a full weight. We used five-year average unemployment due to lack of comparable annual data at local levels. Two-year employment growth and share of the total working age population with a job were each given a half weight, favoring areas with more and growing jobs opportunities.

In the quality of life category, the poverty rate was given a full weight, penalizing cities where serious financial hardship is more common. The share of the population that struggles to put food on the table either due to low income or distance from a grocery store, known as the food insecurity rate, was given full weight. A city's mortality rate, calculated as the number of people who died while in hospital care per hospital by city, was also given full weight. In cases where city-level data was not available, mortality rates were imputed from county-level data.

The drug overdose mortality rate was given a one-quarter weighting, as was the hospital readmission rate, or the share of those released from the hospital who were readmitted within 30 days. Distance from the center of the city to the nearest hospital was given full weight.
Measures used in the community category include the average travel time to work, which was given full weight. The violent crime rate – the total number of rapes, robberies, murders, and aggravated assaults per 100,000 people – was given full weight. So too was the property crime rate, which is the total number of burglaries, larcenies, motor vehicle thefts, and incidents of arson per 100,000 people.

The share of commuters either walking, cycling, or taking public transit to work was given half weight. The total number of colleges in the area and the number of restaurants, bars, museums, theatre companies, movie theatres, libraries, and parks per capita were each given a one-quarter weighting.

The number of hospitalizations that would have been prevented by regularly scheduled doctor visits for every 1,000 Medicare enrollees – known as the preventable hospitalization rate – was given half weighting.

Median household income, median home value, average travel time to work, poverty rate, population, employment-to-population ratio, median property taxes paid, and average unemployment rate are all five-year estimates from the U.S. Census Bureau's American Community Survey and are for 2016. Overall cost of living is for 2014 and comes from data analysis and aggregation company ATTOM Data Solutions.

The population-adjusted number of entertainment and cultural venues like restaurants and museums comes from the Census Bureau's County Business Patterns data set, and is for 2016. The number of colleges comes from the Department of Education College Navigator and is as of the 2017-2018 school year.

Violent and property crime rates are from the FBI's 2017 Uniform Crime Report. Drug overdose mortality rates are from the Centers for Disease Control and Prevention and are for the years 2014-2016. Mortality rates and hospital readmission rates are from the Centers for Medicare and Medicaid Services and are as of June 2015. Preventable hospitalizations are from the latest release from County Health Rankings & Roadmaps, a Robert Wood Johnson Foundation and University of Wisconsin Population Health Institute joint program.

24/7 Wall Street is a USA TODAY content partner offering financial news and commentary. Its content is produced independently of USA TODAY.

CLOSE

After sifting through data and numerous living factors, the list of the best cities to live in the U.S. for a $55,000 salary has been revealed. Buzz 60's Justin Kircher has more. Buzz60


Tuesday, February 26, 2019

Why Stamps.com, Campbell Soup, and Diplomat Pharmacy Slumped Today

Friday was a good day on Wall Street, as investors celebrated the prospects for a possible end to the U.S. trade war with China. The Dow Jones Industrial Average crossed the 26,000 mark, finishing with triple-digit gains and leading other major benchmarks higher as well. However, bad news from certain corners of the market held back some individual stocks. Stamps.com (NASDAQ:STMP), Campbell Soup (NYSE:CPB), and Diplomat Pharmacy (NYSE:DPLO) were among the worst performers. Here's why they did so poorly.

Stamps.com gets canceled

Shares of Stamps.com plummeted 58% after the provider of online postage and shipping software released its fourth-quarter financial report. At first, the company's earnings release merely said that its fiscal 2019 results would plunge from 2018 levels, with adjusted earnings declining from $11.78 per share in 2018 to just $5.15 to $6.15 per share in 2019. Later, it became apparent that the drop came in light of Stamps.com's loss of its exclusive partnership with the U.S. Postal Service, which will open the door for competing mail services to sell online postage. Now, Stamps.com will have to find a way to redefine itself with other services to make up the gap, and that's proven difficult for many of its peers.

Two arms holding a box in front of a row of large post office boxes, with Stamps.com logo in the corner.

Image source: Stamps.com.

Campbell cools off

Campbell Soup saw its stock drop 7%. The food company said that it would sell a refrigerated soup plant in the state of Washington to private investment company Joshua Green, but what likely prompted the decline in the share price was news elsewhere in the industry. With shares of Kraft Heinz plunging by more than 30% due to sluggish business performance and worries about future growth, investors in Campbell didn't hesitate to conclude that the soup giant faces many of the same potential pressures. Activist investors are looking at ways to turn Campbell around, but exactly how that might happen remains to be seen.

Diplomat makes a costly delay

Finally, shares of Diplomat Pharmacy plunged 56.5%. The specialty pharmaceutical company said that it wouldn't release its latest financial results as planned, instead announcing a delay until March 15. Diplomat explained the move in part, announcing that it would likely take a charge of about $630 million related to its pharmacy benefit management business. That division hasn't done well since its acquisition in 2017, and Diplomat said that it would withdraw its 2019 guidance based on weak January performance and rising competition. None of that was good news for shareholders, and it'll take considerable work for Diplomat to regain investors' confidence.

Sunday, February 24, 2019

Virginia Retirement Systems ET AL Grows Stake in Keysight Technologies Inc (KEYS)

Virginia Retirement Systems ET AL lifted its position in shares of Keysight Technologies Inc (NYSE:KEYS) by 200.6% in the 4th quarter, according to its most recent filing with the Securities & Exchange Commission. The fund owned 145,200 shares of the scientific and technical instruments company’s stock after buying an additional 96,900 shares during the quarter. Virginia Retirement Systems ET AL owned approximately 0.08% of Keysight Technologies worth $9,014,000 at the end of the most recent quarter.

Other large investors have also recently added to or reduced their stakes in the company. Sun Life Financial INC purchased a new stake in Keysight Technologies in the 4th quarter valued at about $32,000. Parkside Financial Bank & Trust grew its holdings in Keysight Technologies by 41.3% in the 4th quarter. Parkside Financial Bank & Trust now owns 527 shares of the scientific and technical instruments company’s stock valued at $33,000 after buying an additional 154 shares during the period. Guardian Life Insurance Co. of America purchased a new stake in Keysight Technologies in the 4th quarter valued at about $33,000. Ipswich Investment Management Co. Inc. purchased a new stake in Keysight Technologies in the 4th quarter valued at about $37,000. Finally, Loeb Partners Corp purchased a new stake in Keysight Technologies in the 4th quarter valued at about $39,000. 84.73% of the stock is owned by institutional investors and hedge funds.

Get Keysight Technologies alerts:

In other news, SVP Ingrid A. Estrada sold 15,462 shares of the company’s stock in a transaction on Monday, December 3rd. The stock was sold at an average price of $62.26, for a total value of $962,664.12. Following the completion of the sale, the senior vice president now owns 92,121 shares in the company, valued at $5,735,453.46. The sale was disclosed in a legal filing with the SEC, which is available at this link. Also, SVP Satish Dhanasekaran sold 1,354 shares of the company’s stock in a transaction on Wednesday, December 19th. The shares were sold at an average price of $61.54, for a total value of $83,325.16. Following the completion of the sale, the senior vice president now owns 29,337 shares of the company’s stock, valued at approximately $1,805,398.98. The disclosure for this sale can be found here. In the last three months, insiders sold 249,925 shares of company stock valued at $14,923,747. Company insiders own 0.65% of the company’s stock.

Several research firms have recently weighed in on KEYS. Zacks Investment Research lowered Keysight Technologies from a “buy” rating to a “hold” rating in a research note on Friday, February 15th. ValuEngine raised Keysight Technologies from a “hold” rating to a “buy” rating in a research report on Friday, December 28th. Jefferies Financial Group boosted their price target on Keysight Technologies from $74.00 to $75.00 and gave the stock a “buy” rating in a research report on Wednesday, November 21st. Finally, TheStreet lowered Keysight Technologies from an “a-” rating to a “c+” rating in a research report on Tuesday, November 20th. One analyst has rated the stock with a hold rating and ten have assigned a buy rating to the company’s stock. The company presently has an average rating of “Buy” and an average price target of $73.44.

KEYS traded up $0.02 during trading on Thursday, reaching $81.10. 66,024 shares of the company were exchanged, compared to its average volume of 1,887,523. The company has a market cap of $15.12 billion, a P/E ratio of 27.05 and a beta of 1.13. The company has a debt-to-equity ratio of 0.53, a current ratio of 1.63 and a quick ratio of 1.20. Keysight Technologies Inc has a 52 week low of $45.31 and a 52 week high of $81.65.

Keysight Technologies (NYSE:KEYS) last issued its quarterly earnings data on Tuesday, November 20th. The scientific and technical instruments company reported $0.96 EPS for the quarter, topping the Zacks’ consensus estimate of $0.84 by $0.12. Keysight Technologies had a return on equity of 22.80% and a net margin of 4.25%. The firm had revenue of $1.05 billion during the quarter, compared to the consensus estimate of $1.02 billion. During the same period in the prior year, the business earned $0.71 EPS. The firm’s revenue was up 19.7% on a year-over-year basis. As a group, research analysts anticipate that Keysight Technologies Inc will post 3.5 earnings per share for the current year.

COPYRIGHT VIOLATION WARNING: “Virginia Retirement Systems ET AL Grows Stake in Keysight Technologies Inc (KEYS)” was originally published by Ticker Report and is owned by of Ticker Report. If you are viewing this story on another site, it was stolen and reposted in violation of US and international copyright & trademark law. The legal version of this story can be accessed at https://www.tickerreport.com/banking-finance/4168549/virginia-retirement-systems-et-al-grows-stake-in-keysight-technologies-inc-keys.html.

About Keysight Technologies

Keysight Technologies, Inc provides electronic design and test solutions to commercial communications, networking, aerospace, defense and government, automotive, energy, semiconductor, and electronic industries in the Americas and the Asia Pacific. Its Communications Solutions Group segment provides radio frequency and microwave test instruments, and electronic design automation software tools; oscilloscopes, logic and serial protocol analyzers, logic-signal sources, arbitrary waveform generators, and bit error rate testers; optical modulation analyzers, component analyzers, power meters, and optical laser source solutions, as well as optical amplifier, filter, and other passive component solutions; and related software solutions.

Featured Article: What is a Call Option?

Want to see what other hedge funds are holding KEYS? Visit HoldingsChannel.com to get the latest 13F filings and insider trades for Keysight Technologies Inc (NYSE:KEYS).

Institutional Ownership by Quarter for Keysight Technologies (NYSE:KEYS)

Friday, February 22, 2019

Q1 2019 Earnings Forecast for Quest Diagnostics Inc Issued By SunTrust Banks (DGX)

Quest Diagnostics Inc (NYSE:DGX) – Stock analysts at SunTrust Banks decreased their Q1 2019 earnings per share (EPS) estimates for shares of Quest Diagnostics in a note issued to investors on Tuesday, February 19th. SunTrust Banks analyst D. Macdonald now anticipates that the medical research company will post earnings of $1.35 per share for the quarter, down from their prior forecast of $1.52. SunTrust Banks currently has a “Positive” rating and a $96.00 target price on the stock. SunTrust Banks also issued estimates for Quest Diagnostics’ Q2 2019 earnings at $1.71 EPS, Q3 2019 earnings at $1.71 EPS, Q4 2019 earnings at $1.69 EPS, FY2019 earnings at $6.46 EPS and FY2020 earnings at $6.76 EPS.

Get Quest Diagnostics alerts:

Quest Diagnostics (NYSE:DGX) last issued its quarterly earnings results on Thursday, February 14th. The medical research company reported $1.36 EPS for the quarter, missing analysts’ consensus estimates of $1.37 by ($0.01). The business had revenue of $1.84 billion for the quarter, compared to the consensus estimate of $1.88 billion. Quest Diagnostics had a net margin of 9.77% and a return on equity of 15.23%. The firm’s revenue was down 1.4% on a year-over-year basis. During the same quarter in the previous year, the business earned $1.40 earnings per share.

A number of other analysts have also weighed in on DGX. Zacks Investment Research raised Quest Diagnostics from a “sell” rating to a “hold” rating in a research note on Tuesday, February 12th. Piper Jaffray Companies dropped their price objective on Quest Diagnostics from $110.00 to $100.00 and set a “neutral” rating for the company in a research note on Thursday, February 14th. Barclays reissued a “buy” rating and set a $114.00 price objective on shares of Quest Diagnostics in a research note on Friday, February 15th. Mizuho set a $106.00 price objective on Quest Diagnostics and gave the company a “buy” rating in a research note on Friday, February 15th. Finally, UBS Group set a $91.00 price objective on Quest Diagnostics and gave the company a “hold” rating in a research note on Friday, February 15th. Two investment analysts have rated the stock with a sell rating, ten have given a hold rating and nine have given a buy rating to the company’s stock. The stock has an average rating of “Hold” and a consensus price target of $102.82.

NYSE:DGX opened at $87.81 on Thursday. The company has a market cap of $11.98 billion, a PE ratio of 13.92, a P/E/G ratio of 2.06 and a beta of 0.89. Quest Diagnostics has a fifty-two week low of $78.95 and a fifty-two week high of $116.49. The company has a quick ratio of 0.87, a current ratio of 0.94 and a debt-to-equity ratio of 0.65.

The firm also recently declared a quarterly dividend, which was paid on Wednesday, January 30th. Investors of record on Tuesday, January 15th were paid a $0.53 dividend. This is a positive change from Quest Diagnostics’s previous quarterly dividend of $0.50. The ex-dividend date of this dividend was Monday, January 14th. This represents a $2.12 dividend on an annualized basis and a yield of 2.41%. Quest Diagnostics’s dividend payout ratio (DPR) is presently 33.60%.

Hedge funds have recently made changes to their positions in the stock. Mirae Asset Global Investments Co. Ltd. purchased a new stake in Quest Diagnostics in the third quarter worth $743,000. USS Investment Management Ltd raised its holdings in Quest Diagnostics by 3.0% in the fourth quarter. USS Investment Management Ltd now owns 103,300 shares of the medical research company’s stock worth $8,603,000 after purchasing an additional 3,000 shares in the last quarter. CenturyLink Investment Management Co raised its holdings in Quest Diagnostics by 10.3% in the fourth quarter. CenturyLink Investment Management Co now owns 12,861 shares of the medical research company’s stock worth $1,071,000 after purchasing an additional 1,196 shares in the last quarter. Tdam USA Inc. raised its holdings in Quest Diagnostics by 9.4% in the fourth quarter. Tdam USA Inc. now owns 7,236 shares of the medical research company’s stock worth $603,000 after purchasing an additional 622 shares in the last quarter. Finally, Legacy Financial Advisors Inc. bought a new position in Quest Diagnostics in the fourth quarter worth $45,000. 85.73% of the stock is owned by institutional investors.

Quest Diagnostics Company Profile

Quest Diagnostics Incorporated provides diagnostic testing information and services in the United States and internationally. The company's Diagnostic Information Services business segment develops and delivers diagnostic testing information and services, such as routine testing, non-routine and advanced clinical testing, gene-based and esoteric testing, anatomic pathology, and other diagnostic information services.

Read More: Understanding debt-to-equity ratio in fundamental analysis

Earnings History and Estimates for Quest Diagnostics (NYSE:DGX)

Thursday, February 21, 2019

What's Behind CVS Health's Fourth-Quarter Loss?

When CVS Health (NYSE:CVS) reported its third-quarter earnings in early November, the big story really wasn't about the results. Instead, investors were primarily focused on the pharmacy giant's impending acquisition of Aetna. The acquisition was finalized only a few weeks later.

CVS Health announced its fourth-quarter results before the market opened on Wednesday. The integration of Aetna into the company's financial performance for the quarter was certainly important. But CVS Health's Omnicare long-term care (LTC) pharmacy business also shared the spotlight this time -- and not for a good reason. Here are the highlights from CVS Health's fourth-quarter report. 

CVS pharmacist at counter across from a customer

Image source: CVS Health.

CVS Health results: The raw numbers Metric Q4 2018 Q4 2017 Year-Over-Year Change
Sales $54.4 billion $48.4 billion 12.4%
Net income from continuing operations ($421 million) $3.3 billion N/A
Adjusted earnings per share $2.14 $1.92 11.5%

Data source: CVS Health. N/A = not applicable.

What happened with CVS Health this quarter?

CVS Health reported a solid revenue gain from the prior-year period. Most of the growth came from the inclusion of Aetna's revenue, which totaled $5.5 billion during the period from Nov. 28, 2018, through Dec. 31, 2018.

The company's retail pharmacy business also performed well, with a 5.4% year-over-year revenue increase driven by higher prescription volumes and higher branded drug prices. Prescription volumes increased in large part due to continued adoption of the company's patient care programs, collaborations with pharmacy benefits managers (PBMs), and CVS Health's preferred status in several Medicare Part D networks.

CVS Health's own PBM business experienced modest growth in the fourth quarter. Revenue edged up 2.2% over the prior-year period, with higher pharmacy claims volume partially offset by continued pricing pressure from customers.

But with all of the relatively good news, CVS Health still posted a net loss of $421 million in the fourth quarter. Why? The company recorded a goodwill impairment charge of $2.2 billion in the fourth quarter (and $6.1 billion for the full year) related to its struggling LTC pharmacy unit.

CVS Health noted that its Omnicare LTC business continues to face multiple challenges. These issues include lower occupancy rates in skilled nursing facilities (SNF), reimbursement pressures on LTC facilities, and a significant deterioration in the financial health of SNF customers.

The company's non-GAAP earnings, however, weren't weighed down by the big LTC goodwill write-off. As a result, CVS Health still reported solid year-over-year adjusted EPS growth.

What management had to say

CEO Larry Merlo said: "2018 was a milestone year for CVS Health as we successfully completed our transformational merger with Aetna, began effective implementation of our integration strategy, and took important steps toward building the integrated healthcare model that will bring substantial value to our various stakeholders. We had strong financial performance and delivered on our operating expectations."

Merlo added:

With the completion of the Aetna acquisition, we have set the stage for CVS Health to excel in a market that is rapidly transforming. We strongly believe in the long-term value that the full breadth of our capabilities can provide. Our unique combination will drive above-market growth going forward across all of the enterprise. Maintaining our focus on community-level products and services will drive meaningful value for both consumers and payors, while improving our bottom line and the value we return to shareholders. Ultimately, our open platform model allows us to meet the needs of all payors with newly created products and services. We're more excited than ever about the opportunities that lie ahead.

Looking forward

CVS Health expects that its full-year 2019 GAAP diluted EPS from continuing operations will be between $4.88 and $5.08. The company projects adjusted EPS between $6.68 and $6.88. Even the upper end of this range is lower than the adjusted EPS that CVS reported for full-year 2018.

Merlo acknowledges that "2019 will be a year of transition" for CVS Health. The company will be busy integrating Aetna into its business. It has work to do in turning around its Omnicare LTC business. And CVS Health continues to face strong rivals in retail pharmacy.

But in Merlo's presentation at the J.P. Morgan Healthcare Conference in January, he said that acquiring Aetna will allow CVS Health to create "a new front door to healthcare." Merlo stated that over time, the acquisition would pay off in a big way for shareholders. Achieving that vision, however, will take longer than one quarter -- or even one year.

Wednesday, February 20, 2019

Analysts Anticipate HubSpot Inc (HUBS) to Announce $0.25 Earnings Per Share

Wall Street brokerages expect HubSpot Inc (NYSE:HUBS) to post earnings per share of $0.25 for the current quarter, Zacks Investment Research reports. Nine analysts have issued estimates for HubSpot’s earnings, with the highest EPS estimate coming in at $0.27 and the lowest estimate coming in at $0.21. HubSpot reported earnings of $0.15 per share in the same quarter last year, which would indicate a positive year over year growth rate of 66.7%. The firm is expected to report its next quarterly earnings report on Thursday, May 9th.

According to Zacks, analysts expect that HubSpot will report full year earnings of $1.16 per share for the current financial year, with EPS estimates ranging from $1.12 to $1.27. For the next financial year, analysts anticipate that the company will post earnings of $1.67 per share, with EPS estimates ranging from $1.41 to $1.92. Zacks Investment Research’s earnings per share calculations are an average based on a survey of research analysts that that provide coverage for HubSpot.

Get HubSpot alerts:

HubSpot (NYSE:HUBS) last announced its quarterly earnings data on Tuesday, February 12th. The software maker reported $0.37 earnings per share for the quarter, beating the Zacks’ consensus estimate of ($0.17) by $0.54. HubSpot had a negative net margin of 12.44% and a negative return on equity of 17.08%. The business had revenue of $144.02 million for the quarter, compared to analyst estimates of $137.48 million. During the same period last year, the business earned $0.12 EPS. The company’s revenue was up 35.2% on a year-over-year basis.

A number of equities research analysts have recently weighed in on the stock. Raymond James raised their price objective on shares of HubSpot from $155.00 to $181.00 and gave the company an “outperform” rating in a report on Wednesday, February 13th. Zacks Investment Research upgraded shares of HubSpot from a “hold” rating to a “buy” rating and set a $170.00 price objective on the stock in a report on Monday, January 28th. Deutsche Bank raised their price objective on shares of HubSpot from $150.00 to $168.00 and gave the company a “hold” rating in a report on Wednesday, February 13th. Canaccord Genuity raised their price objective on shares of HubSpot from $160.00 to $190.00 and gave the company a “buy” rating in a report on Wednesday, February 13th. Finally, Needham & Company LLC restated a “buy” rating and issued a $198.00 price objective (up from $145.00) on shares of HubSpot in a report on Wednesday, February 13th. Nine analysts have rated the stock with a hold rating, ten have given a buy rating and one has assigned a strong buy rating to the stock. The stock has an average rating of “Buy” and an average target price of $170.29.

In related news, General Counsel John P. Kelleher sold 972 shares of HubSpot stock in a transaction on Thursday, January 3rd. The shares were sold at an average price of $122.60, for a total transaction of $119,167.20. Following the sale, the general counsel now directly owns 39,659 shares in the company, valued at approximately $4,862,193.40. The sale was disclosed in a document filed with the Securities & Exchange Commission, which is available through this hyperlink. Also, CEO Brian Halligan sold 15,277 shares of HubSpot stock in a transaction on Thursday, December 20th. The stock was sold at an average price of $123.18, for a total transaction of $1,881,820.86. Following the sale, the chief executive officer now owns 680,046 shares in the company, valued at $83,768,066.28. The disclosure for this sale can be found here. Insiders have sold a total of 46,763 shares of company stock worth $6,156,940 over the last quarter. 9.60% of the stock is owned by company insiders.

A number of large investors have recently made changes to their positions in HUBS. Capital Research Global Investors raised its stake in HubSpot by 164.5% during the 3rd quarter. Capital Research Global Investors now owns 1,900,059 shares of the software maker’s stock worth $286,814,000 after acquiring an additional 1,181,611 shares in the last quarter. 1832 Asset Management L.P. grew its position in HubSpot by 2,435.9% during the 4th quarter. 1832 Asset Management L.P. now owns 388,000 shares of the software maker’s stock worth $47,549,000 after purchasing an additional 372,700 shares during the last quarter. TIAA CREF Investment Management LLC grew its position in HubSpot by 358.0% during the 3rd quarter. TIAA CREF Investment Management LLC now owns 362,839 shares of the software maker’s stock worth $54,771,000 after purchasing an additional 283,609 shares during the last quarter. North Peak Capital Management LLC purchased a new position in HubSpot during the 4th quarter worth $15,397,000. Finally, Polar Capital LLP grew its position in HubSpot by 51.4% during the 4th quarter. Polar Capital LLP now owns 309,191 shares of the software maker’s stock worth $38,875,000 after purchasing an additional 104,956 shares during the last quarter. Hedge funds and other institutional investors own 93.19% of the company’s stock.

Shares of HUBS traded down $0.08 during midday trading on Monday, reaching $166.09. The stock had a trading volume of 838,913 shares, compared to its average volume of 716,332. HubSpot has a 1-year low of $101.45 and a 1-year high of $180.00. The firm has a market capitalization of $6.58 billion, a price-to-earnings ratio of -162.83 and a beta of 1.92. The company has a current ratio of 3.01, a quick ratio of 3.15 and a debt-to-equity ratio of 1.30.

HubSpot Company Profile

HubSpot, Inc provides a cloud-based marketing and sales software platform for businesses in the Americas, Europe, and the Asia Pacific. Its software platform includes integrated applications, such as social media, search engine optimization, blogging, Website content management, marketing automation, email, sales productivity, CRM, analytics, and reporting.

Read More: What is the balance sheet?

Get a free copy of the Zacks research report on HubSpot (HUBS)

For more information about research offerings from Zacks Investment Research, visit Zacks.com

Earnings History and Estimates for HubSpot (NYSE:HUBS)

Monday, February 18, 2019

Could Albemarle Corporation Be a Millionaire Maker Stock?

Albemarle Corporation (NYSE:ALB) is one of the largest producers of lithium in the world. The metal is a vital component in high-tech batteries, like the ones that are increasingly finding their way into electric vehicles. That said, lithium is a commodity subject to often unpredictable investor sentiment. That's been very bad news of late, but if long-term demand expectations play out as hoped Albemarle could still turn out to be a millionaire-maker stock.

Ups and downs

Albemarle's stock rose a dramatic 48% in 2017 as lithium prices moved higher through most of the year. Investors were excited by the metal's importance in making batteries for electric vehicles. With every major automaker working to build electric vehicles, this market is expected to explode. The hype and excitement around it was at a peak in 2017, and led to a huge run-up in anything related to lithium, including Albemarle's share price.

An electric car charging device

Image source: Getty Images

The stock then turned around and fell 40% in 2018 as lithium prices moved steadily lower through most of that year. The big catalyst was a shift in investor sentiment, not any material change in the electric vehicle market or Albemarle's business; in fact, Albemarle's 2018 fundamentals remained pretty solid. Although it won't reported full-year 2018 results until late February, through the first nine months of 2018 revenue was up 10% year over year, with adjusted earnings, which removed one-time items, advancing 21%. For reference, weak lithium prices were more than offset by volume expansion in the lithium operation. The company also reported solid results at its other divisions (more on this below).

It's pretty clear that Albemarle is being driven by the lithium story more than business fundamentals. The stock isn't appropriate for risk-averse investors -- the big commodity price-driven price swing is clear evidence of this. However, there are a number of reasons why more aggressive investors might want to step aboard what could be a millionaire-maker stock.

The long play

For starters, the company doesn't just mine for lithium. It has two other divisions as well: One makes bromine, a flame retardant used in electronics and other areas, and the other makes catalysts, primarily for the energy industry. These two divisions aren't small -- combined, they account for roughly 60% of Albemarle's revenue. Both have been performing pretty well lately, but the big picture here is that the company is using these operations as the financial foundation from which to expand in lithium.

Albemarle isn't a one-trick pony that will live and die based on the volatile price of just one commodity. It has a diversified business to see its plans through. To be fair, CEO Luke Kissam has stated that the company might eventually sell its other operations and become a pure-play lithium company. But that's not the situation today, and the bromine and catalyst operations help to offset the risk of the lithium expansion process and the market's on again/off again romance with the industrial metal. Moreover, if the company does decide to dispose of these two divisions, the move will likely result in a cash infusion that will shore up Albemarle's balance sheet, which would be a net positive even if asset sales reduce diversification.

ALB Chart

ALB data by YCharts

With this as a background, it's time to actually look at lithium. Obviously a big piece of the lithium story is investor sentiment, which is driving the price of the metal up and down. But the longer-term picture here is based on demand. Albemarle is projecting lithium demand to increase roughly 18% a year between 2017 and 2025, pushed higher by massive growth in demand from the electric vehicle market. How realistic is this outlook? It's around the midpoint of the estimates produced by industry watchers, including many of the largest investment banks.

To meet the demand that Albemarle is projecting, the company is working to swiftly ramp up production. That includes building new lithium operations, such as a recent investment in an Australian project, and expanding existing assets. The benefit of this is that production increases, like in 2018, can offset volatile commodity prices and allow the company to continue growing earnings. Albemarle's production goals are pretty substantial, too. It hopes to increase production as much as 30% in 2019, around 45% in 2020, and another 30% or so in 2021.

Putting it all together

Albemarle is working off of a solid diversified foundation as it rapidly expands its production of lithium to meet the robust demand it expects from electric vehicles. The worst case scenario appears to be that it continues to perform well on a fundamental level (including lithium production offsetting weak lithium prices), which investors will eventually take note of -- and likely reward with modest stock price appreciation. However, if lithium prices move higher again, investors are likely to push the price of Albemarle and its expanding lithium business sharply higher again. Either way, it looks like investors end up on top, with an upturn in lithium prices likely to quickly turn the shares into a really big winner.

Sunday, February 17, 2019

Joint Corp (JYNT) Given Consensus Recommendation of “Buy” by Brokerages

Joint Corp (NASDAQ:JYNT) has been assigned an average rating of “Buy” from the six ratings firms that are presently covering the stock, MarketBeat.com reports. One analyst has rated the stock with a hold rating and five have assigned a buy rating to the company. The average 1 year price target among brokers that have covered the stock in the last year is $10.00.

Separately, DA Davidson started coverage on Joint in a research report on Thursday, January 17th. They set a “buy” rating and a $10.00 price objective for the company.

Get Joint alerts:

Shares of NASDAQ JYNT traded up $0.02 during trading hours on Monday, reaching $9.17. The stock had a trading volume of 51,550 shares, compared to its average volume of 26,194. Joint has a fifty-two week low of $4.67 and a fifty-two week high of $9.64. The company has a quick ratio of 1.36, a current ratio of 1.36 and a debt-to-equity ratio of 0.75. The stock has a market cap of $126.18 million, a PE ratio of -36.68, a price-to-earnings-growth ratio of 3.12 and a beta of 0.62.

In related news, Director James H. Amos, Jr. acquired 5,000 shares of the firm’s stock in a transaction on Thursday, December 20th. The stock was bought at an average cost of $6.79 per share, with a total value of $33,950.00. Following the transaction, the director now owns 77,797 shares of the company’s stock, valued at $528,241.63. The acquisition was disclosed in a document filed with the Securities & Exchange Commission, which is available at the SEC website. 3.20% of the stock is currently owned by company insiders.

A number of institutional investors have recently bought and sold shares of JYNT. Northern Trust Corp raised its stake in shares of Joint by 16.1% during the 4th quarter. Northern Trust Corp now owns 16,614 shares of the company’s stock worth $138,000 after buying an additional 2,300 shares in the last quarter. Alambic Investment Management L.P. purchased a new position in shares of Joint during the 4th quarter worth approximately $152,000. Globeflex Capital L P purchased a new position in shares of Joint during the 4th quarter worth approximately $210,000. Advisory Services Network LLC raised its stake in shares of Joint by 42.6% during the 3rd quarter. Advisory Services Network LLC now owns 27,780 shares of the company’s stock worth $238,000 after buying an additional 8,299 shares in the last quarter. Finally, Perkins Capital Management Inc. raised its stake in shares of Joint by 33.0% during the 3rd quarter. Perkins Capital Management Inc. now owns 68,500 shares of the company’s stock worth $586,000 after buying an additional 17,000 shares in the last quarter. 50.70% of the stock is owned by institutional investors.

About Joint

The Joint Corp. develops, owns, operates, supports, and manages chiropractic clinics in the United States. It operates through direct ownership, management arrangements, franchising, and the sale of regional developer rights. As of August 9, 2018, the company operated approximately 400 clinics. The company was founded in 2010 and is headquartered in Scottsdale, Arizona.

Further Reading: What is a stock split?

Cognex Corporation (CGNX) Q4 2018 Earnings Conference Call Transcript

Logo of jester cap with thought bubble with words 'Fool Transcripts' below it

Image source: The Motley Fool.

Cognex Corporation (NASDAQ:CGNX) Q18 2018 Earnings Conference Call Feb. 14, 2019, 5:00 p.m. ET

Contents: Prepared Remarks Questions and Answers Call Participants Prepared Remarks:

Operator

Greeting and welcome to Cognex's Fourth Quarter 2018 Earnings Conference Call. At this time, all participants are in a listen-only mode. A question-and-answer session will follow the formal presentation. If anyone should require operator assistance during the conference, please press "*0" on your telephone keypad. As a reminder, this conference is being recorded.

I would now like to turn the conference over to your host, John Curran, Chief Financial Officer. Please go ahead.

John Curran -- Senior Vice President and Chief Financial Officer

Thank you and good evening, everyone. I'm John Curran, Cognex's CFO and I would like to welcome you to our Fourth Quarter Earnings Conference Call. With me on today's call are Dr. Bob Shillman, Cognex's Chairman, and Rob Willett, Cognex's President and CEO. Please note that our earnings release and Form 10-K are available on the Cognex website at www.cognex.com. Both contain detailed information about our financial results.

During the call, we may use a non-GAAP financial measure if we believe it is useful to investors or if we believe it will help investors better understand our results or business trends. You can see a reconciliation of certain items from GAAP to non-GAAP in Exhibit 2 of the earnings release.

Any forward-looking statements we made in the earnings release or any that we may make during this call are based upon information that we believe to be true as of today. Things can change, however, and actual results may differ materially from those projected or anticipated. You should refer to our SEC filings, including our most recent Form 10-K, for a detailed list of these risk factors.

With that, I will now turn the call over to Dr. Bob.

Robert Shillman -- Chairman

Thanks, John. Hello, everyone. Thank you for joining us. And I hope it's still culturally acceptable to say happy Valentine's Day but if that offended anyone, I will immediately take responsibility for that and issue a dramatic apology.

Tonight, we reported record fourth quarter and full-year results from continuing operations for revenue, for net income, and for earnings per share. And as we expected and reported to you on our last call, our growth rate did slow at the end of 2018 because of slower spending by customers, particularly in China, and you'll hear more about that detail later in the call.

I'll now turn the call over to my partner, Rob Willett, who will provide much more detail into our 2018 results. Rob, the microphone is yours.

Robert Willett -- President and Chief Executive Officer

Thank you, Dr. Bob, and good evening, everyone. For 2018, we reported our ninth consecutive year of record revenue. This achievement follows a spectacular 2017 that included substantial investments by our customers in machine vision for OLED display and smartphone manufacturing.

We faced tough comparisons to 2017 when a few large customers scaled back their purchases in 2018. As a result, annual revenue grew by only 5% over 2017. However, if you exclude those customers, the increase was 18%, reflecting substantial contributions from the rest of our business.

Cognex performed well in a number of end markets, notably logistics and automotive. Our logistics business grew by more than 50% over 2017. With annual revenue surpassing $100 million, it has become a meaningful part of our business. The growth outlook for logistics remains strong. Cognex is now widely recognized as the technology leader for machine vision in this market and we are rapidly gaining market share.

In automotive, annual revenue grew by high single digits year-on-year, just short of our 10% long-term growth expectation for that market. Following two consecutive years of faster growth, the industry began to slow in the second half of 2018. Despite recent softness in this market, we see the potential for growth in the medium and long-term, as recent trends in the automotive industry drive significant changes in technology and automation.

In 2018, Cognex invested a record $116 million, or 14% of revenue, in engineering, marking our ninth consecutive year or RD&E growth. We believe that investing in engineering will keep Cognex on the leading edge of vision technology. In that regard, we launched several high-performing products during 2018.

VisionPro ViDi integrates the power of deep learning technology we acquired in 2017 into the Cognex VisionPro platform. It's now easier for sophisticated customers to use our deep learning techniques with our industry-leading vision tools.

Deep learning is one of the most exciting advances in our market in the past 20 years and Cognex is viewed as the leader in applying this new technology to industrial machine vision. Our deep learning-based image analysis software opens a new range of applications for Cognex where our traditional rule-based vision doesn't apply.

Our DataMan 470 Barcode Reader was the most successful product launch in Cognex history, in terms of sales generated within the first six months. This high-performance reader has been rapidly adopted in the logistics industry, as well as in general manufacturing.

The MX-1502ER broadens our vision-enabled mobile terminal family to include extended range reading. The MX-1502ER can read codes in quick succession from as near as six inches to as far as 30 feet, a capability that improves our position in the high-potential mobile terminal market.

In Q4, we introduced the 9000 Series of our industry-leading In-Sight smart camera, enabling ultra-high-resolution machine vision in an easy-to-use product.

In 2018, we added more than 350 cognoids worldwide. Most of these new employees were hired in sales and in engineering. Also of note, we successfully implemented our new SAP enterprise resource planning system, which provides a platform to scale our operations and understand our business with greater clarity as we approach $1 billion in annual revenue.

Turning now to key financial metrics, gross margin was within our expected range for 2018 but our success in the logistics market has required engineering to support to help customers get up and running. This support has been slightly dilutive to our overall gross margin and it is expected to continue to be in the first half of 2019. We consider this as a worthwhile near-term cost of winning share and introducing our leading-edge products to customers in the large, fast-growing logistics market. Our strategy for developing this market is similar to the one we used successfully in the factory automation market nearly 20 years ago. The downward pressure on our overall gross margin should ease as we move through the back half of this year.

Moving on to operating margin, our focus on the long-term led to investments during a slower growth year in 2018 that reduced Cognex's overall operating margin below the exceptional levels we saw in 2017. We believe that our long-term growth will be the result of our continued technology leadership and a larger salesforce.

 I will now turn the call over to John for financial details from the fourth quarter.

John Curran -- Senior Vice President and Chief Financial Officer

Thanks, Rob. At the outset, let me remind everyone that our results reflect the retroactive adoption of the new revenue standard that took effect in 2018. Those changes do not materially impact gross margin dollars but did lower the gross margin percentage from historical rates by one to two percentage points.

As Dr. Bob and Rob mentioned, we reported good results for the fourth quarter. Revenue for the quarter was $193 million, which was slightly above the top end of our guidance. As expected, revenue declined from Q3 due to the seasonality associated with consumer electronics. Revenue in Q4 '18 grew by 6% over Q4 of '17. Our results for the quarter reflect an increasing level of customer uncertainty in certain areas of our business.

Looking at revenue by industry, consumer electronics declined, as expected, in Q4, due to lower revenue from large customers in OLED display and smartphone manufacturing. Excluding the impact of those large customers, revenue grew in the mid-teens over Q4 '17, led by strong performance in logistics, which nearly doubled. Automotive revenue in Q4 '18 was roughly flat year-on-year compared to high single-digit growth for all of 2018. The other industries we serve continued to grow but at a combined rate that was slower than earlier in the year.

Turning to gross margin, the three point decline from Q4 '17 was due to a higher percentage of revenue coming from application-specific solutions for logistics customers in Q4 '18.

Operating expenses totaled $95 million in Q4, up 9% year-on-year and flat sequentially. The increase in OpEx was driven mostly by new hires in sales and in key business areas where we see higher growth potential, such as logistics, deep learning, and 3D. While we continue to invest for long-term growth, we are mindful of the market uncertainty we have observed in recent months. We intend to focus on productivity improvements and will remain prudent with regard to discretionary spending in the coming months.

Operating margin in Q4 was 23%, down from 28% in Q4 of 2017, reflecting both the shift in revenue mix and our OpEx investments to support continued growth.

The effective tax rate was 14% before discrete items, down from our forecasted rate of 16% due to a shift of income from higher to lower tax jurisdictions. This benefited the quarter by approximately $4 million. Excluding all discrete tax adjustments, we reported earnings of $0.26 per share compared to $0.24 for Q4 of 2017.

Looking at revenue year-on-year from a geographic perspective, market conditions were as expected in Q4. The Americas delivered the largest contribution to growth, both in absolute dollars and in percentage terms. That growth was led by substantially higher revenue from logistics customers.

Revenue in Europe was down from Q4 '17 because of the decline in consumer electronics but the modest growth we experienced in other areas was in line with our expectations.

In Greater China, revenue was relatively flat. The softer trends we saw in the third quarter across our end markets in China continued to weigh on growth in Q4. Revenue from Other Asia was also flat year-on-year because of the OLED smartphone headwind. The region performed well otherwise in Q4 but the rate of growth has slowed among our machine-build customers who sell into the Chinese market.

Looking at our balance sheet, we have nearly $800 million in cash and investments with no debt. And, lastly, inventory decreased $11 million from Q3 '18, as we expected.

I will now turn the call back to Rob.

Robert Willett -- President and Chief Executive Officer

Thanks, John. Turning to guidance, revenue for the first quarter is expected to be between $165 million and $175 million, which, at the midpoint, is flat year-on-year. We expect gross margin for Q1 go be in the mid-70% range, similar to the gross margin we reported for Q4. Operating expense is expected to be up slightly on a sequential basis. Also, we expect the effective tax rate to be 15% excluding discrete tax items.

To summarize, Cognex is performing well given current market conditions. The outlook remains uneven across end markets and geographic regions. Logistics, deep learning, and 3D all represent near-term growth drivers for us. We also continue to broaden our reach to new customers and bring new products to market. Demand from China is soft after many quarters of outperformance and that softness is affecting electronics, OEMs, and other Cognex customers who rely on exports to China. In addition, we are seeing delayed spending and project push-outs by our customers in the American automotive market. As for consumer electronics, we should be prepared to discuss the large order potential for 2019 in our Q1 call.

With that, we will now open the call to questions. Operator, please go ahead.

Questions and Answers:

Operator

Thank you. At this time, we will be conducting a question-and-answer session. If you would like to ask a question, please press "*1" on you telephone keypad. A confirmation tone will indicate your line is in the question queue. You may press "*2" if you would like to remove your question from the queue. During the Q&A session, please limit yourself to one question and one follow-up prior to getting back in the queue. For participants using speaker equipment, it may be necessary to pick up your handset before pressing "*". One moment, please, while we poll for questions.

Our first question comes from the line of Josh Pokrzywinski with Morgan Stanley. Please proceed with your question. Josh Pokrzywinski, please proceed with your question.

Josh Pokrzywinski -- Morgan Stanley -- Analyst

Hey, can you guys hear me?

Robert Willett -- President and Chief Executive Officer

Yes, we can. Hi, Josh.

Josh Pokrzywinski -- Morgan Stanley -- Analyst

Hi. Sorry about that. Just, first, I guess on logistics, clearly, you've had some pretty awesome growth there the last several years. And I wanted to get an update on the state of play. Any new things you've seen out of competition -- good, bad, indifferent -- new customer growth versus growth within the existing customer base, and then anything new or different that we should be aware of geographically?

Robert Willett -- President and Chief Executive Officer

Okay. So, your question is sort of about how the logistics market is developing for Cognex. So, I would say we've seen a very rapid growth rate in our logistics business in the last few years and revenue from logistics was more than $100 million. It grew more than 50%.

Our business there has really started out very much in e-commerce, companies that I think are reinventing supply chain and differentiate themselves by quick supply and major investments in automation to do that. And it's grown more broadly and we're seeing, certainly, more regular retail companies, I think, under pressure from what's happening with e-commerce. But, more generally, seeing the benefits of automation, start to adopt more sophisticated automation, and very much adopt Cognex Vision and the technology and advantages we can bring them. So, we're certainly seeing our reputation build.

Our largest market is America but we're seeing rapid growth spread into Europe also and some good business picking up in Asia as well, as that develops. Other things, certainly, we do serve the parcel market. The career parcel and package business and postal, as well, are accounts for us. But those markets sometimes have bigger, more systems-integrated type solutions that we're not really best positioned to serve them yet but we do see some business in that space and we expect more to come in the future.

Other things, I would say there is longer term potential to broaden our business, which primarily is in barcode reading today, but to broaden more into more and more vision applications, where we're doing things with 2D vision, such as looking at things like hazardous labels or damage to boxes, and into 3D vision, where we'll be doing things like dimensioning and providing more information to customers and packages. And then even broader, I would say a longer term trend that I think has a lot of legs and is beginning and where Cognex, I think, already has a very good reputation is in more how we connect up and provide information from the readers, an area variously referred to as Industrial IoT or Industry 4.0.

Josh Pokrzywinski -- Morgan Stanley -- Analyst

Got it. That's very helpful color. And then just one and I'll let some of my other peers on the call go through consumer electronics in more detail. But just one on that from me. I understand the business is down and it's kind of a growth-year business over time. I wouldn't expect a lot of end markets for you to decline multiple years in a row. But we have seen, in that broader industry, CapEx budgets come in and oftentimes cited as getting leverage on existing tooling. I don't think of Cognex as necessarily being the be all, end all of that definition of tooling but how do you think about tough versus easy comps still in the consumer electronics space at large?

Robert Willett -- President and Chief Executive Officer

Yes. So, Josh, I think we'll be in a better position to give you a sense of how the year is shaping up in that industry in Q1. I mean, if you look back over the years that we've had major business in that space, there's a lot of things being analyzed and considered for implementation at this time of year. And, in general, they would have to do with new features or new technologies being adopted within smartphones. Of course, OLED was a big one but we see many different ways. And, generally, there's always new technology under consideration for adoption and we get more clarity in the next couple of months on what actually is going to be going. And so, certainly, that's the case. And then, of course, there's a need to improve productivity. So, to what degree customers have ambitions to remove what is still huge amounts of labor from that process as they look to automate? So, I think there's a long way for what machine vision and automation can do in that space to run. I think your question probably gets at something we're not ready to give you a good insight in right now, which is how does it look for this year.

Josh Pokrzywinski -- Morgan Stanley -- Analyst

Understood. Thanks, Rob. I'll leave it there.

Operator

Our next question comes from the line of Richard Eastman with Robert W. Baird and Company. Please proceed with your question.

Richard Eastman -- Robert W. Baird & Co. -- Analyst

Yes. Thank you. Good afternoon. Could you perhaps just kind of walk us through a little bit of the automotive business? Did it stay soft or soften in all three regions in the quarter? And would it be best to assume, with a first half where you really have some big comparisons in auto, do you think the auto business can grow for you in '19? You should have a little bit better visibility there, I would think.

Robert Willett -- President and Chief Executive Officer

Yeah, thanks, Rick. Well, I'd say if there's a word that would describe what we're seeing at the moment, it's uncertainty. Right? So, I think there's uncertainty around many of our industries but certainly automotive. So, I'll tick through regions. We see broad softness in China, capital expenditure being delayed across the region.

Europe, in contract, we see performing relatively well at the moment. It's not buoyant but it's growing. And I think in Europe, what we saw is they had some kind of challenges in that market in the middle of last year and now customers appear to have worked through those issues around diesel engines and emission standards that caused a delay and we're starting to see more concerted and more planned investments around the future of automotive, particularly around electric vehicles and new technologies that require significant and, in some cases, quite complex automation.

What we're seeing in the Americas is that the market seems to be scaling back and delaying large automation projects at the moment. And that's something we saw more recently, in December and January and the first part of February. So, it seems to be, I guess, uncertainty, again, in that space. And particularly among larger capital projects. That's where we're seeing it. We would expect to have seen in a normal year many more of those breaking loose at the moment. So, there seems to be tentativeness about that.

So, I think we have positive views about the long-term plans for our automotive customers and good visibility into those longer term plans but we're certainly seeing some shorter term anxiety, mostly in China and America. And then it's hard to give you a view on that, given it's not clear how long that uncertainty, particularly, I would say, in the Chinese market, is going to continue and how much it's related to trade talks and other things that are going on. So, it's hard to give you a better sense of 2019 but we can certainly discuss it more as we move through the year.

Richard Eastman -- Robert W. Baird & Co. -- Analyst

Okay. And then I noticed in the K, your largest customer was about 15% of your revenue in '18, which works to a bigger number than we might have thought. Did you suggest that in the fourth quarter, year-over-year, was that one -- your largest customer, was revenue up or was it down for that particular customer in the fourth quarter?

Robert Willett -- President and Chief Executive Officer

I think, unfortunately, we don't talk about specifics related really to any customer's revenue in the quarter and certainly not that one.

Richard Eastman -- Robert W. Baird & Co. -- Analyst

Okay. And just one last question --

Robert Willett -- President and Chief Executive Officer

And maybe I wonder if we can help you by talking more broadly about consumer electronics. And I think we mentioned a few, a very few, large customers in smartphone and OLED. So, perhaps we can help frame your question in that context. John?

John Curran -- Senior Vice President and Chief Financial Officer

Yeah. I think we did kind of discuss across a number of large customers a roughly $15 million headwind in the quarter. Is that what you were referring to, Rick?

Richard Eastman -- Robert W. Baird & Co. -- Analyst

So, well, there's a $15 million headwind, you're suggesting, in the fourth quarter of '17?

John Curran -- Senior Vice President and Chief Financial Officer

Yeah, compared fourth quarter '17 to fourth quarter '18.

Richard Eastman -- Robert W. Baird & Co. -- Analyst

Okay. All right. I'm not sure how to interpret that but I will do my best.

Robert Willett -- President and Chief Executive Officer

Well, let's try again. Let's see if we can clarify. I think what we're saying is we referred to a few customers in that area of OLED and smartphone and we saw a $15 million headwind in Q4 of '18 compared to Q4 of '17.

Richard Eastman -- Robert W. Baird & Co. -- Analyst

Okay. Okay. Just one last question about the VisionPro ViDi that you've spoken to. I think that is in market and was there -- this is kind of the first deep learning tool that you have. And I'm curious, were there some pre-orders for that or any early adopters? What market is that targeted at? That product?

Robert Willett -- President and Chief Executive Officer

Yes. Our ViDi technology addresses broad markets that we address overall. So, quite similar to our overall mix. So, certainly, we have significant customers and early adopters in electronics and in automotive. But we see them in all kinds of markets, actually, too.

Richard Eastman -- Robert W. Baird & Co. -- Analyst

Okay. Okay. All right. Thank you very much.

Robert Willett -- President and Chief Executive Officer

Thank you.

Operator

Our next question comes from the line of Joe Ritchie with Goldman Sachs. Please proceed with your question.

Joe Ritchie -- Goldman Sachs -- Analyst

Thanks. Good afternoon, everyone, and happy Valentine's Day, Dr. Bob. So, maybe just starting on auto for a second. Rob, can you just remind us, in North America, what percentage of your business is North America auto?

Robert Willett -- President and Chief Executive Officer

Yeah, I'm not sure that's something we disclose but I would say a little less than half. Roughly half. Yeah, of the Americas business. Exactly. I think we've said -- over the years, we've told you that automotive is about a quarter of our business, overall, on a global basis.

Joe Ritchie -- Goldman Sachs -- Analyst

Yeah. Okay. That makes sense. And then maybe just kind of following on that last line of questioning around -- you guys called out that $15 million headwind in 4Q. When you did your revenue forecast for the first quarter, are there any specific headwinds either related to OLED or anything else that you'd like to call out?

John Curran -- Senior Vice President and Chief Financial Officer

No, in the first quarter, there's no material effect in the first quarter in consumer electronics.

Joe Ritchie -- Goldman Sachs -- Analyst

Okay. All right. Fair enough. And then, I guess, as we progress through the year, you talked a little bit about the gross profit rate improving as the year progressed, partly due to some investments that are occurring in the first half. Can you maybe just talk a little bit more about those investments? And then the follow-on to that is, given logistics is growing at such a fast pace, is it fair to assume that, from a mix perspective, you're probably going to have these headwinds for some time, just given how quickly that market is growing?

Robert Willett -- President and Chief Executive Officer

Joe, there are a number of factors at play here. One is, as we would move through the year, we normally would expect a different mix in revenue with much more consumer electronics and other business kind of flowing through the P&L. So, that's, I think, one thing to keep in mind. But to address this issue of what's going on in logistics, we have new customers, some of them significant in size, beginning to adopt Cognex machine vision. And they're not necessarily the most sophisticated or experienced users of machine vision so we're doing more work for them in applications engineering to help them adopt and use the technology. It's something we only do for large and important customers, in general.

Another factor is the logistics market, it's been around a long time and there's been a lot of laser-based systems sold into that market. Very hard to configure, long setup, laser-based barcode readers. And so the industry has become used to suppliers and companies coming in and actually doing that installation themselves. As our technology is much easier to configure -- often, we think it takes less than 25% of the time to set up a Cognex barcode reading tunnel in a logistics distribution center as it would to set up a line scan vision system or a laser-based system that the share leader in this market sells. Right? But in order to kind of make sure we get that business and get customers going, we're doing a little more applications engineering.

Now, we expect to introduce products to help customers and to lessen the percentage of that type of business that we see in our logistics P&L. And we expect to see some benefits of that or some improvements start to come in later in the year. That's kind of our overall view on that.

Joe Ritchie -- Goldman Sachs -- Analyst

That's helpful, Rob. If I could just sneak in one more. You mentioned giving us an update on electronics and the outlook for the year in the first quarter. Are you guys planning to give a full-year guidance like you did last year or how are you thinking about the guidance for the year?

Robert Willett -- President and Chief Executive Officer

In general, it's not our practice to give full-year guidance at all, for anything. But in that case, it was obviously so material and we understood the headwind that we were facing and so we were able to share it with you. We're not willing to commit, at this point, on whether we'll give you a longer term view of consumer electronics for the year. But we'll be better positioned to sort of address that in 13 weeks from now.

Joe Ritchie -- Goldman Sachs -- Analyst

Okay, great. Thank you.

Operator

Our next question comes from the line of Joe Ricchiuti with Needham and Company. Please proceed with your question.

Jim Ricchiuti -- Needham & Company -- Analyst

I think it's Jim.

Robert Willett -- President and Chief Executive Officer

Your brother. Your brother, maybe.

Jim Ricchiuti -- Needham & Company -- Analyst

The twin brother. Afternoon. So, the question I have is just with respect to the decline in revenues that you saw last year from your large customer. Was that consistent, Rob, with the decline overall that you saw with other consumer electronics-related business or was that decline worse? It sounds like it was worse more broadly in the consumer electronics market.

Robert Willett -- President and Chief Executive Officer

Yeah, we're sort of thinking. I would probably say it was similar but John's looking at some data here. I think our largest takeaway is that we have a few customers, a select few, in that OLED smartphone space and we saw more than one have a material impact, in terms of decline. And your question is, is that similar to what we saw in the overall consumer electronics industry.

John Curran -- Senior Vice President and Chief Financial Officer

So, if we break it down, Jim, what we saw, we had declines from a few large customers, while the remainder of the business actually grew during the year. So, net-net, we saw an overall decline in our consumer electronics, the overall business, but that mix was quite different when you look at a couple of large customers versus the remainder of that industry group.

Jim Ricchiuti -- Needham & Company -- Analyst

Got it. And with respect to the logistics business, it sounds like you're suggesting that some of the headwind that you've seen on gross margins resulting from working closely with some customers in logistics, that that's going to ease somewhat in the second half of the year. Is that a correct way to characterize it?

Robert Willett -- President and Chief Executive Officer

Yes. It is. You know us very well, Jim, and you know that we're about great technology that's easy to adopt and high gross margin. So, we don't really look to be doing a lot of applications engineering unless it's for a very good reason and we see it, in the short-term, as being a very good thing to do in the logistics market. But that's not where we intend to end up in terms of gross margin.

Jim Ricchiuti -- Needham & Company -- Analyst

Got it. And then just related to that, Rob, would you anticipate the logistics business having the same kind of growth profile that you saw last year in 2018? That 50% type growth?

Robert Willett -- President and Chief Executive Officer

Yeah, what we've said is we see that business growing at 50% annually for the foreseeable future.

Jim Ricchiuti -- Needham & Company -- Analyst

Okay. Thank you.

Operator

Our next question comes from the line of Paul Coster with J.P. Morgan. Please proceed with your question.

Paul Coster -- J.P. Morgan -- Analyst

Yeah, thanks very much. Can you tell us a little bit about the backlog, which looks to have risen year-on-year, and what the composition might tell us about the trends that you're seeing? And to the extent you can, how much visibility have you got? I imagine it's not much more than the quarter but I would love your thoughts there, please.

John Curran -- Senior Vice President and Chief Financial Officer

Yeah, so we usually don't get into the details of backlog. But in terms of our forward visibility, it's consistent with our forward visibility in other periods. It's really 3-6 months out. Things obviously get more clear the closer we get.

Paul Coster -- J.P. Morgan -- Analyst

And so the mix is similar to the mix that we've seen in the business previously, we should just assume then, unless otherwise advised?

John Curran -- Senior Vice President and Chief Financial Officer

Yeah. I mean, the mix -- obviously, as logistics grows, the mix of our backlog would -- logistics as a percentage of backlog would grow.

Paul Coster -- J.P. Morgan -- Analyst

Okay. Maybe I could just go back to comments that Rob made about the application-specific work that's being done in the logistics space that's weighing temporarily on margins. It sounds like it goes by the second half of the year. Why is that? Will you actually productize the developments that you've made and then just sort of make it cookie-cutter, easy to use? Or is there some other reason why it starts to get easier in the second half?

Robert Willett -- President and Chief Executive Officer

I think there's a number of reasons, not all of which I want to talk about for competitive reasons. But, certainly, one is we're teaching customers to apply our technology and then we're letting them get on with it. Right? So, that's certainly one reason that we don't need to do so much application engineering. But other things have to do with our technology roadmap.

Paul Coster -- J.P. Morgan -- Analyst

Okay. All right. And my last question is have you seen any difference in the behavior between large customers across any vertical and the smaller customers in those same verticals? In other words, is this hesitancy we're seeing -- and we heard this on a call last night -- is the hesitancy sort of specific to the large customers or is it broad-based?

Robert Willett -- President and Chief Executive Officer

I'll discuss your question in two geographic areas. So, in China, it doesn't seem specific to large versus small customers. The area where is it notable is more in America, where we're seeing notably fewer large projects breaking loose. More projects over $100,000.00 in scope, which might be large capital projects when you consider all the automation that's getting matched up. We're seeing those being deferred at a much larger rate than they were in any recent period.

Paul Coster -- J.P. Morgan -- Analyst

Okay. Good. Thank you very much.

Operator

Our next question comes from the line of Joe Giordano with Cowen and Company. Please proceed with your question.

Joseph Giordano -- Cowen and Company -- Analyst

Hey, guys. How are you doing?

Robert Willett -- President and Chief Executive Officer

Hey, Joe.

Joseph Giordano -- Cowen and Company -- Analyst

I just want to clarify something. We talked about the margin dilution from logistics a bit here. Is there anything on the products specifically being sold into that vertical that's lower margin or is this solely the impact of you guys spending that item to install?

Robert Willett -- President and Chief Executive Officer

In general, the products we sell into logistics are very similar or the same as the technology that we sell into factory automation and they have great gross margins. What we do see in logistics is sometimes the use of more optics, mirrors, field of view expanders, which in and of themselves aren't particularly margin-different, but setting them up, applying them, that requires much more service, which hits our P&L in gross margin as a service expense which is at lower gross margin. And as we are learning to deploy these, we're becoming more efficient. Right? So, that's sort of the dynamic that's going on.

Joseph Giordano -- Cowen and Company -- Analyst

Okay. That's helpful. When I think about R&D, given the amount of development over the last several years, would you say that incremental innovation from here is structurally more expensive than it used to be?

Robert Willett -- President and Chief Executive Officer

No. I wouldn't. I think there's definitely economies of scale that go with what we do. But in other aspects, there are technologies that are much more complex and newer. I think, particularly, of deep learning and 3D, where we're investing and it's a new frontier for vision. So, overall, I don't see the profile changing. We're benefiting from scale. We're getting very good and we're doing the same things that we've been doing for 36 years but applying that into some of these new areas can have a higher level of spend as we get into them.

Joseph Giordano -- Cowen and Company -- Analyst

If I can just sneak in one more, there's a lot of talk, given just the geopolitical tensions, about perhaps some major companies -- and I'm not trying to talk about anyone specifically -- but potentially moving production spaces back to the U.S. And I'm just curious if that's coming through in any of your discussion or if it's even high-level thoughts on the topic for you guys.

Robert Willett -- President and Chief Executive Officer

Yeah. So, we work with the most sophisticated manufacturers in the world and the most sophisticated contract manufacturers in the world. So, certainly, they are talking to us about their plans and, certainly, I have been in discussions in the last few weeks where major contract manufacturers are talking about more investment in certain markets and moving production from certain markets into others. In some cases, those relate to just the growth opportunities they see -- electronics in India might be an example. And in other cases, I think, due to some of their technology and strategy plans. And I'm seeing some more of that in America. I met with a large contract manufacturer recently who clearly has plans for that. So, there definitely is more discussion of that, I would say, in the last six months than I've seen over my ten years in this industry.

Joseph Giordano -- Cowen and Company -- Analyst

Great color. Thank you.

Operator

Our next question comes from the line of Matt Summerville with D.A. Davidson. Please proceed with your question.

Matthew Summerville -- D.A. Davidson -- Analyst

Thanks. Just two questions. First, outside of CE, auto, and logistics, the remainder 25% or so of the company, can you talk about whether you're seeing more broad-based slowing in some of those end markets, whether they be general industrial, food/beverage, pharma, semiconductor, etc.? Can you frame up sort of the other piece of Cognex that hasn't been talked about?

Robert Willett -- President and Chief Executive Officer

Yeah. Hi, Matt. Sure. So, it is very broad-based. Sometimes the growth that goes on in those markets can be quite volatile, by which I mean this can be some large projects going on in deployment in certain areas, like product security in tobacco or big deployments in consumer products that go on. So, that can tend to obscure some of what's going on. But what's going on underneath over a longer period is those smaller markets have high growth rates. And the reason they do is our products are getting less expensive, easier to use, and easier to integrate. And so we're now coming within the reach of more regular manufacturers who can apply machine vision and we focused a lot on that. It's the reason that we really need to grow our salesforce and our distribution network so we can reach all those new customers. So, that's going well.

Matthew Summerville -- D.A. Davidson -- Analyst

And then, lastly, just as a follow-up, a housekeeping item. Could you disclose what FX headwind may have been to revenue in the fourth quarter and what you're anticipating, potentially, in terms of headwind, in Q1 in the guidance you provided?

John Curran -- Senior Vice President and Chief Financial Officer

In the fourth quarter, it was about 1%. And we're not anticipating a material impact in the first quarter.

Matthew Summerville -- D.A. Davidson -- Analyst

Thank you.

Operator

Our next question comes from the line of Andrew Buscaglia with Berenberg Capital Markets. Please proceed with your question.

Andrew Buscaglia -- Berenberg Capital Markets -- Analyst

Hey, guys. Can you talk a little bit about your SG&A spend? I mean, it was up 19% or so in 2018 and that's on the heels of a big year last year too. So, at what point does this kind of top out, where you don't need to be spending as much on that side of your business? And if you could also just go into where you expect more spend is needed if you do continue to spend at this rate?

Robert Willett -- President and Chief Executive Officer

Yes. I think, Andrew, we can see we kind of invested quite a lot last year in building out our sales network and building up the number of sales-noids, as we call them, who are able to reach all those customers we were just describing to Matt's question. And then we invested majorly, obviously, in some infrastructure projects, whether it's facilities -- of course, our new ERP system is an example. So, I think some of those have got behind us, although it's capital that will come into the P&L over a longer period.

I would say, in a big picture, we believe really strongly about the potential of machine vision over the long term and the long-term growth prospects of this market. So, we're very serious about being the market leader and making sure that we're doing everything we can to grow our share and maintain that position. And we see high gross margin, we see lots of growth markets, and we want to make sure we're getting to those. So, when we think about this type of thing, we're not thinking about trimming things to hit a quarter number so much as we're thinking about a long-term plan. So, in the long-term, certainly, there's lots of opportunities we see to go on investing in engineering and in our sales channel to make sure that we're getting great products that are easy to integrate, sold to as many customers as can benefit from them.

That said, as top line growth changes and the growth outlook changes, we'll manage our expenses accordingly. And I think you can see that if you look at the sequential growth of expenses over, say, the last six quarters. You can see that we're sort of tapering to make sure that we're more in line. But that's how we manage it.

Andrew Buscaglia -- Berenberg Capital Markets -- Analyst

And is there a region or an end market, mainly, that you're focused on with this spend in 2019, if it does continue?

Robert Willett -- President and Chief Executive Officer

Well, I mean, certainly logistics is a great market and some of the new technologies we've discussed earlier in the call also really warrant some concerted investment. And in terms of other areas, we're obviously going to manage that according to what we see, where, I would say, in other, more established areas, that's how you would see us operating, perhaps more like a regular company.

Andrew Buscaglia -- Berenberg Capital Markets -- Analyst

Okay. And then just one last one. So, you made some interesting acquisitions in 2017. It's hard to get a sense of where you are in developing new products and seeing them flow through into your business. Can you give us a sense of where you are, in terms of your strategy when you picked up those acquisitions, and when you expect a more robust product cycle, I guess, from those specific deals?

Robert Willett -- President and Chief Executive Officer

Yes. So, we made six acquisitions around about two years ago. And we're already seeing the first benefits of those products coming into the market. A good example would be ViDi. We talked about the ViDi technology being brought up inside VisionPro. And we've also brought a lot more robust and powerful deep learning techniques into the suite itself and tools, which you can certainly read about on our website. So, I'd say that's kind of well down the road from a business that we acquired in April of 2017. But lots of exciting stuff coming.

Then we made three acquisitions in the 3D space. So, AQSense, Chiaro, and EnShape. We did formally launch a product -- I think it was earlier this week -- the 3D A5000, which is the highest performance industrial machine vision sensor on the market in terms of the number of pixels and speed with which we can image technology. So, that was technology that came out of the EnShape acquisitions and we've worked over the last less than two years to improve and make robust and integrate within the Cognex platform. So, that's another example of that.

And then we also acquired a business, I suppose about 20 months ago from memory, called, Webscan, which is the leader in technology for barcode verification. And we launched a product last year called the 8072V, which takes that technology and puts it inside a Cognex handheld reader on that platform and allows us to help customers gather very precise information about the quality of the barcodes that they read. And we're in the market with that and we're pleased with the success we're having and it's certainly resonating with our customers who, I think, as you know, want to put barcodes on more and more and more things. An example would be consumer electronics, but automotive also, and they want to hold their suppliers accountable for the quality of those barcodes. And not only is it great that we can help them do that, but it also means that it can help pull through other sales of Cognex barcode readers, as we're both helping the supplier meet those standards and verify them and we're one point of verification from reading at the supplier to reading at the customer itself. So, that's another thing that's been very successful for us.

I think I'm missing an acquisition. Yes. GBI was an automotive -- a very sophisticated applier of vision software to the automotive industry. That was a relatively mature and well-managed business that already really used a lot of Cognex technology. So, we were able to get out of the blocks very fast on that. And when we look at the overall contribution and how we've done against our expectations for those acquisitions, in aggregate, it's gone very well.

Andrew Buscaglia -- Berenberg Capital Markets -- Analyst

Okay. Thanks very much.

Operator

As a reminder, if you would like to ask a question, please press "*1" on your telephone keypad. As a reminder, if you would like to ask a question, please press "*1" on your telephone keypad. One moment, please, as we poll for more questions.

Our next question comes from the line of Ben Rose with Battle Road Research. Please proceed with your question.

Ben Rose -- Battle Road Research -- Analyst

Yes, thank you and good afternoon, Dr. Bob and Rob, John, and Susan. And happy Valentine's Day to all of you. At the risk of getting people in trouble by extending this call a little bit more, I'd just ask one kind of follow-up question to Rob. Your comments on the automotive market, if I might drill down just a bit, I think you sounded a little bit more optimistic near-term about the opportunity in Europe as opposed to America. And I'm wondering is there anything structurally in Europe that's going on that would differ from the U.S.? I mean, namely, are there any trends affecting the broad market that would make the U.S. slower growth over the course of this year and next?

Robert Willett -- President and Chief Executive Officer

Yeah. Hi, Ben. I think the first thing I alluded to was I think the European automotive industry went through a bit of a challenge last year around diesel, new emission standards, and that led to a lot of dislocation in the supply chain. Right? So, I think, in retrospect, as we look back, we saw that causing a reduction in purchases for Cognex automotive business in Europe and we've seen it bounce back nicely from that to the point where it's now growing again, sequentially and year-on-year. So, that's going on.

But I think, getting to your question, I would say my perspective on this would be that the European automotive industry has been a little slow to grasp some of the electric vehicle investments that have been going on and some of the new technologies that have been going on. I think a very good example would be lithium ion batteries, which are at the heart of electric vehicles, where, to my understanding, there really isn't a major European manufacturer of that technology. Right? Where you see a lot of Korean, Chinese companies, American, of course, and Japanese in that space. And I think now there's a much more concerted effort by European automotive. And it would be both the big brand owners but more of our business and our industry is with Tier 1 suppliers, seeing them investing seriously and working on automation plans that's starting to see light later than we saw happening in other parts of the world. So, that's one observation I would make.

Ben Rose -- Battle Road Research -- Analyst

Okay. Thanks very much.

Operator

Our next question comes from the line of Jairam Nathan with Daiwa Asset Management. Please proceed with your question.

Jairam Nathan -- Daiwa Securities -- Analyst

Thanks for taking my question. It's Daiwa Securities. So, just going back to the operating expense, I know you had the ERP implementation this year. Do you expect, now that it's done, to see some benefit from that no longer being there as an expense item?

John Curran -- Senior Vice President and Chief Financial Officer

Yeah. There's obviously some benefit from that. I mean, it wasn't a huge part of our spending this year. I mean, it was about a $10 million asset that we created. But we do expect to generate productivity gains from leveraging that asset, certainly, as we move forward.

Jairam Nathan -- Daiwa Securities -- Analyst

And with respect to long-term margins, I think you mentioned a 30% kind of long-term target. Is that still in place? And how do you see the progression from the current? I think 2018 was about 27.5%.

Robert Willett -- President and Chief Executive Officer

Yeah, Jairam. Our operating model is 20% revenue growth over the long-term and 30% or greater operating margin is what we're looking for. And that served us well for many years and we managed the company with that in mind over the long-term. And we think it's achievable over the long-term.

Jairam Nathan -- Daiwa Securities -- Analyst

And, finally, you mentioned winning a large business, more on the terminal side, about a couple of quarters back, with a Fortune 100 company. Is there any update to that? Any additional events? That would be great if we could talk about it.

Robert Willett -- President and Chief Executive Officer

Yeah. Hi. Yes, of course. So, what we had mentioned then was our first $1 million customer in that space. And we continue to launch products and grow our customer base in that space. So, our percentage growth numbers look good, very good, but it's on a small base. So, that's the update on that market.

Jairam Nathan -- Daiwa Securities -- Analyst

Okay. Thank you.

Operator

Our next question comes from the line of Bobby Eubank with Chevy Chase Trust. Please proceed with your question.

Bobby Eubank -- Chevy Chase Trust -- Analyst

Good evening, everyone. Happy Valentine's Day. Thanks for taking my question. Just kind of high level, what would you constitute as a success or failure, maybe one or two comments on each of those success or failure, over the next 3-5 years? What kind of keeps you up at night and what are some of the bigger opportunities that you guys are going after? Thanks so much and happy Valentine's Day again.

Robert Willett -- President and Chief Executive Officer

That's an interesting question. I think we have a strategic plan we're executing and, as you would expect, it's about bringing market-leading breakthrough innovation and technology. We're enabling our engineers to do that and getting our salesforce able to do that and driving high gross margin growth, at or above that 20% growth rate, over the long-term. That's what we're all about.

But I would also say we're a company that's very proud of our culture. So, we would also measure our success by the culture in the business, our ability to attract, retain, motivate, get the very best out of cognoids. So, we certainly think about that. And that leads me into what keeps me up at night. It would be more, as we grow, we want to make sure that we're maintaining and developing that wonderful, entrepreneurial, growth-driven, innovative culture that we have. So, that gets harder as you get bigger but we focus on it very seriously and look forward to showing you our annual report, which I think is always a good expression of our culture, and that will be hitting the press in the next few weeks.

Bobby Eubank -- Chevy Chase Trust -- Analyst

I look forward to getting one in the mail. Keep up the great work, guys.

John Curran -- Senior Vice President and Chief Financial Officer

Thanks, Bobby.

Operator

Ladies and gentlemen, we have reached the end of the call. I will now turn it back over to Dr. Shillman for closing comments.

Robert Shillman -- Chairman

Well, a great year and a great fourth quarter and I want to thank all of you for attending the call and for covering Cognex and hope to report even better news to you on the subsequent calls. And I'm very happy to see that nobody objected to the happy Valentine's Day reading. So, keep going, guys, and we'll talk to you down the road. Goodnight.

Operator

This concludes today's conference. You may disconnect your lines at this time. Thank you for your participation.

Duration: 61 minutes

Call participants:

John Curran -- Senior Vice President and Chief Financial Officer

Robert Shillman -- Chairman

Robert Willett -- President and Chief Executive Officer

Josh Pokrzywinski -- Morgan Stanley -- Analyst

Richard Eastman -- Robert W. Baird & Co. -- Analyst

Joe Ritchie -- Goldman Sachs -- Analyst

Jim Ricchiuti -- Needham & Company -- Analyst

Paul Coster -- J.P. Morgan -- Analyst

Joseph Giordano -- Cowen and Company -- Analyst

Matthew Summerville -- D.A. Davidson -- Analyst

Andrew Buscaglia -- Berenberg Capital Markets -- Analyst

Ben Rose -- Battle Road Research -- Analyst

Jairam Nathan -- Daiwa Securities -- Analyst

Bobby Eubank -- Chevy Chase Trust -- Analyst

More CGNX analysis

This article is a transcript of this conference call produced for The Motley Fool. While we strive for our Foolish Best, there may be errors, omissions, or inaccuracies in this transcript. As with all our articles, The Motley Fool does not assume any responsibility for your use of this content, and we strongly encourage you to do your own research, including listening to the call yourself and reading the company's SEC filings. Please see our Terms and Conditions for additional details, including our Obligatory Capitalized Disclaimers of Liability.

10 stocks we like better than CognexWhen investing geniuses David and Tom Gardner have a stock tip, it can pay to listen. After all, the newsletter they have run for over a decade, Motley Fool Stock Advisor, has quadrupled the market.*

David and Tom just revealed what they believe are the 10 best stocks for investors to buy right now... and Cognex wasn't one of them! That's right -- they think these 10 stocks are even better buys.

See the 10 stocks

*Stock Advisor returns as of January 31, 2019